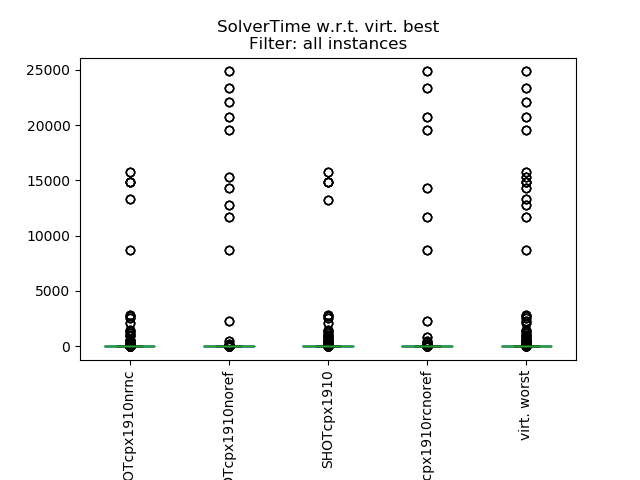
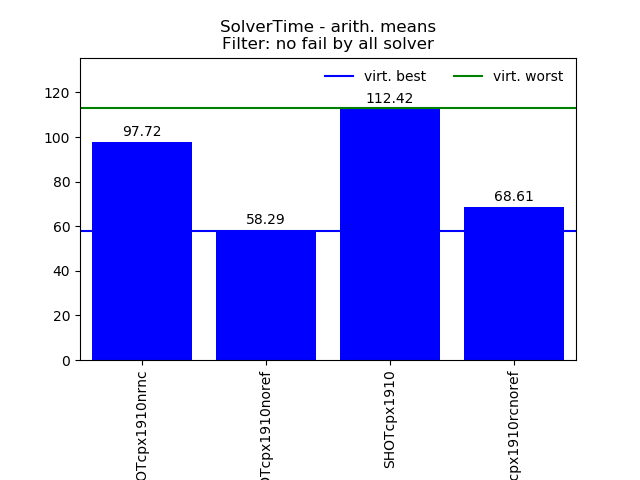
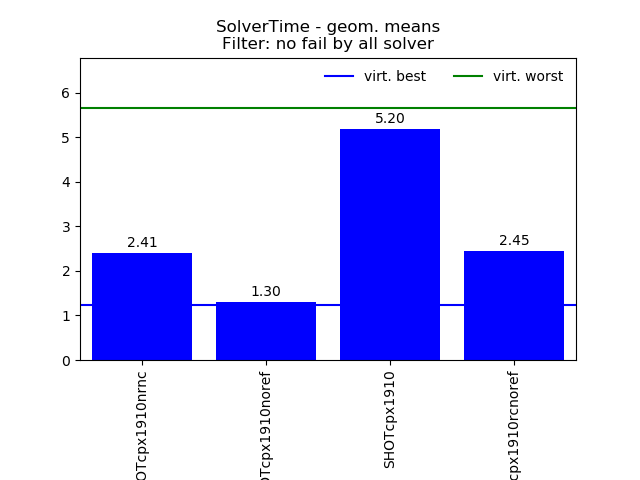
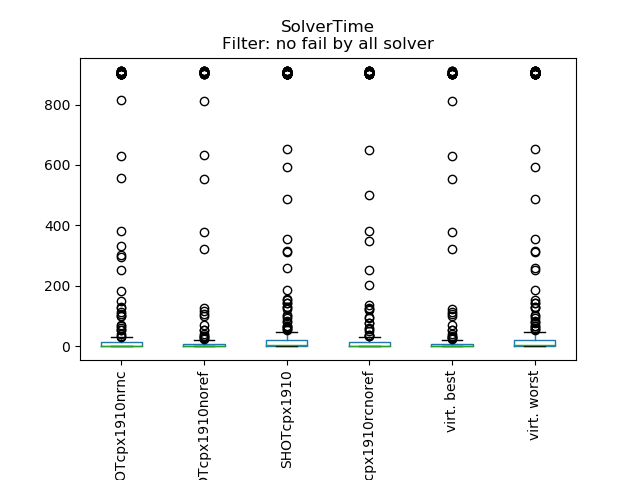
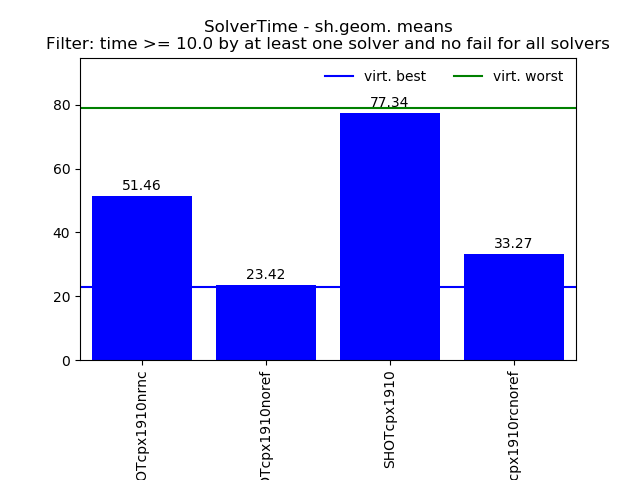
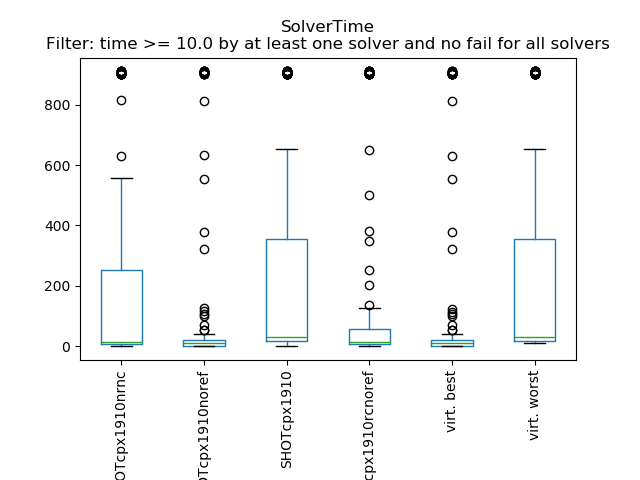
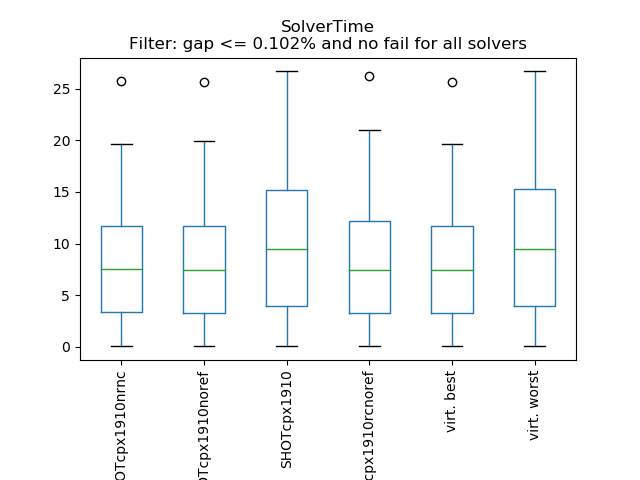
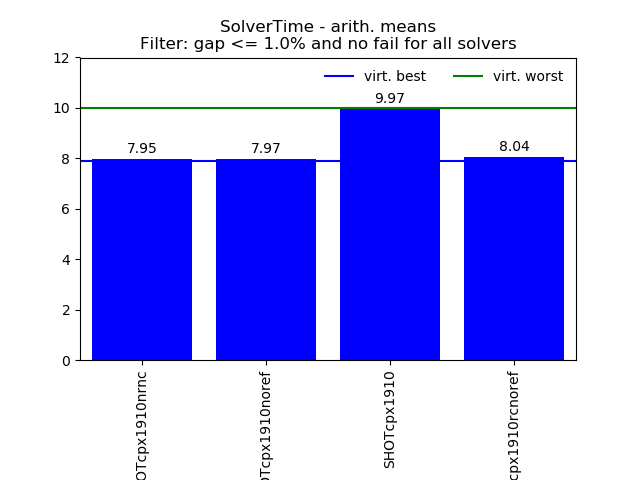
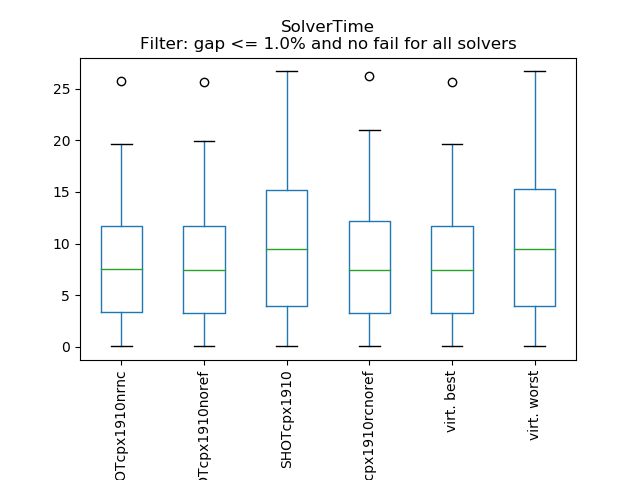
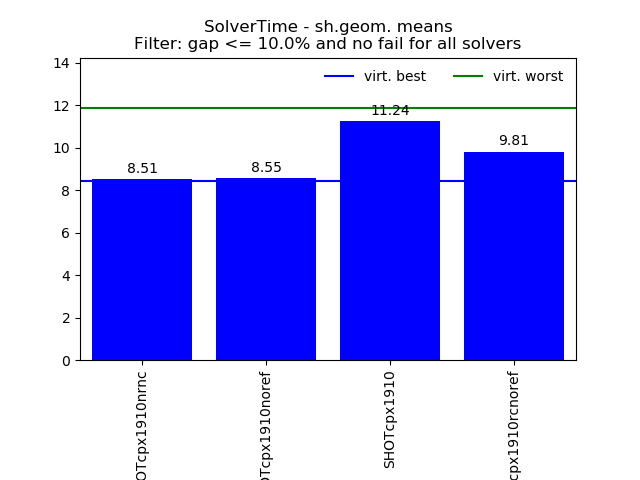
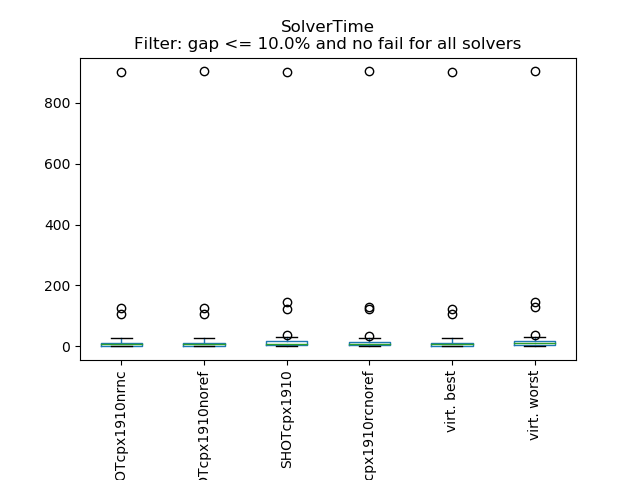
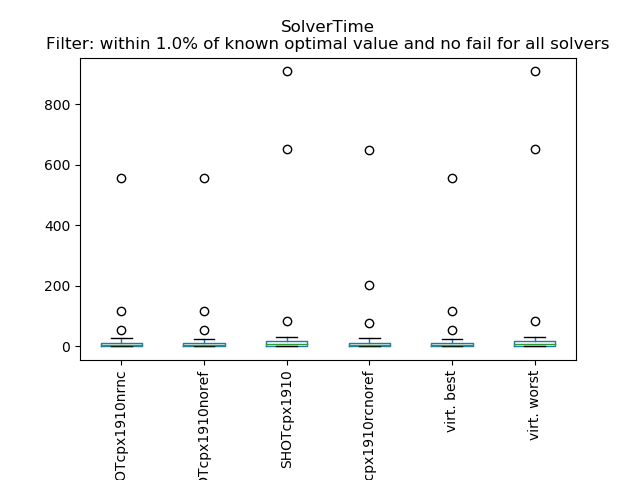
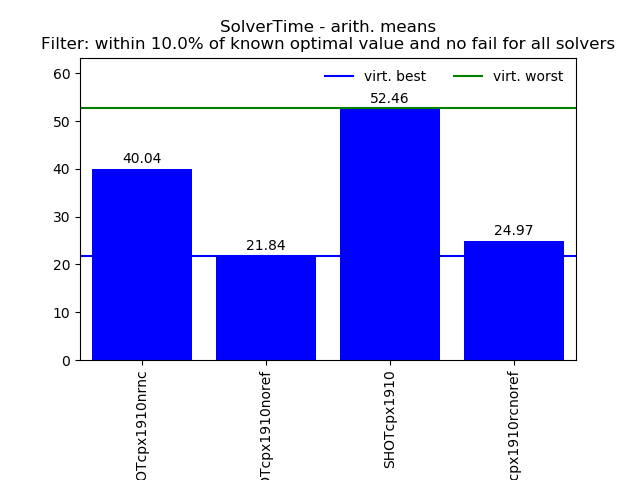
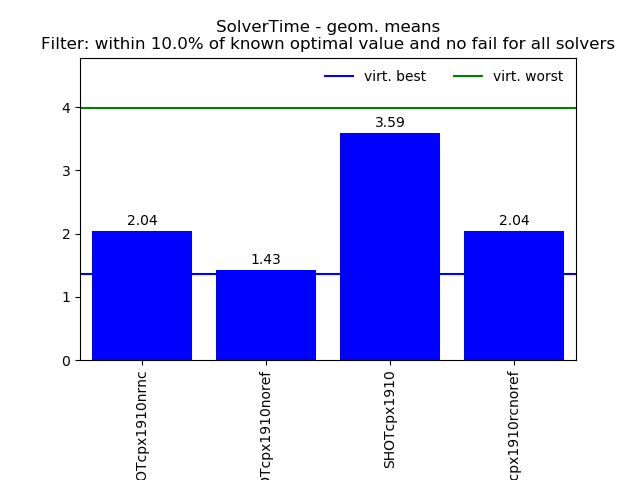
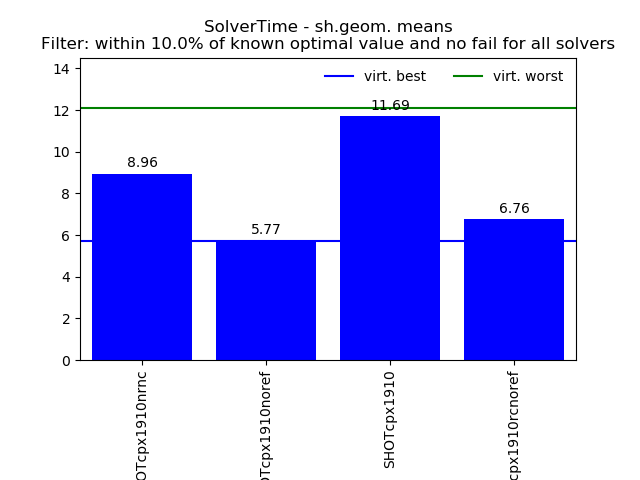
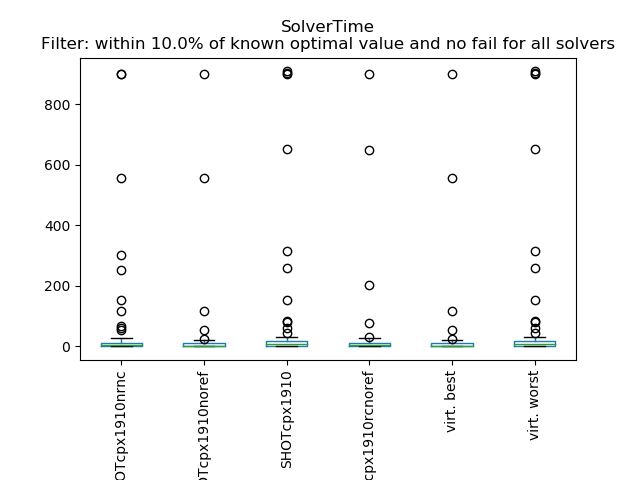
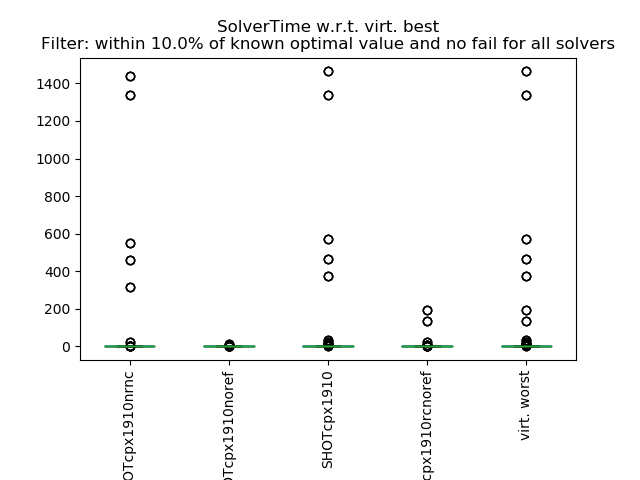
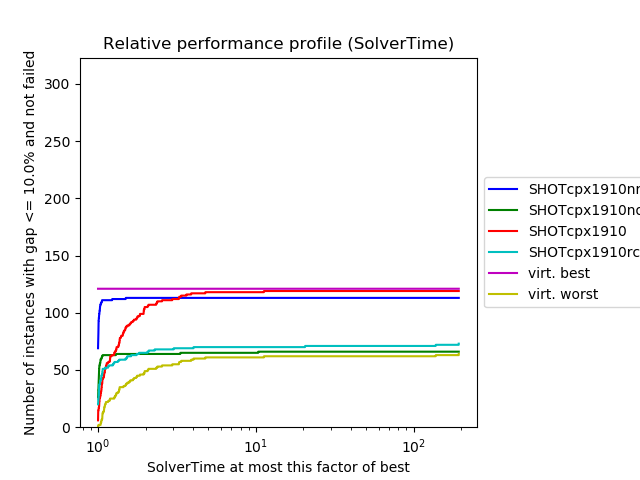
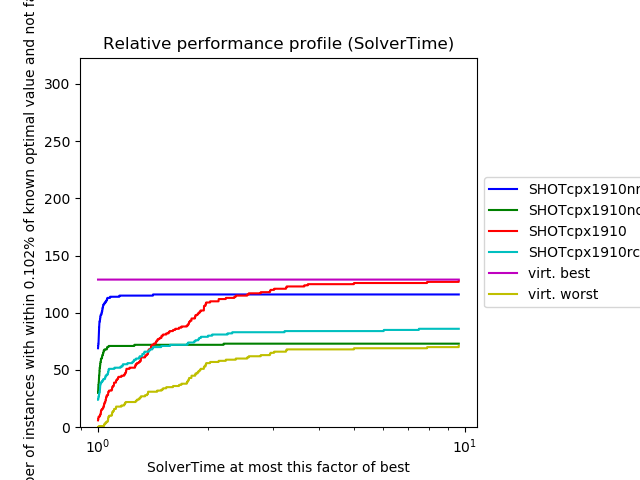
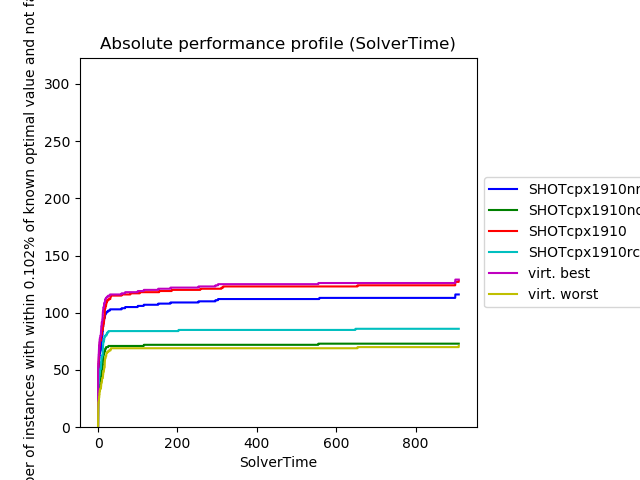
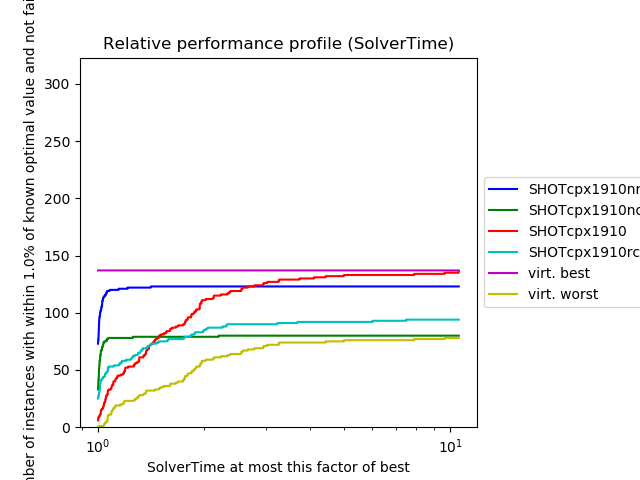
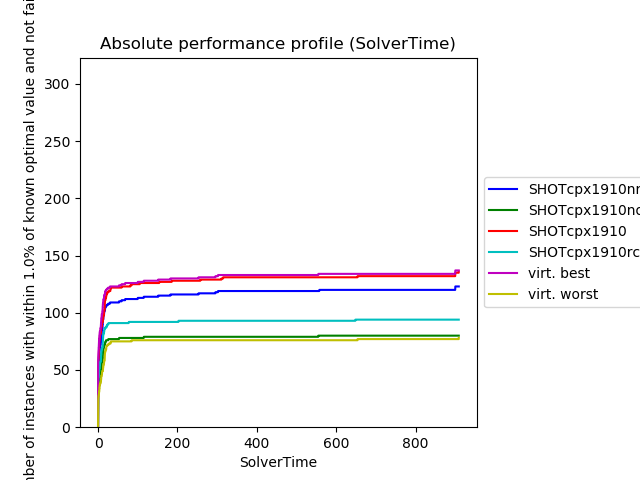
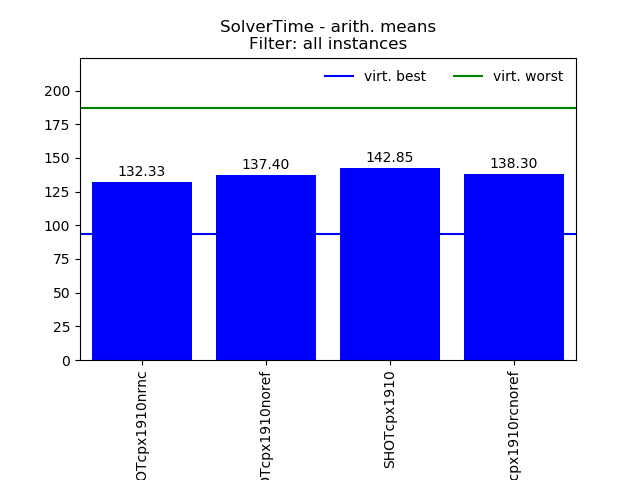
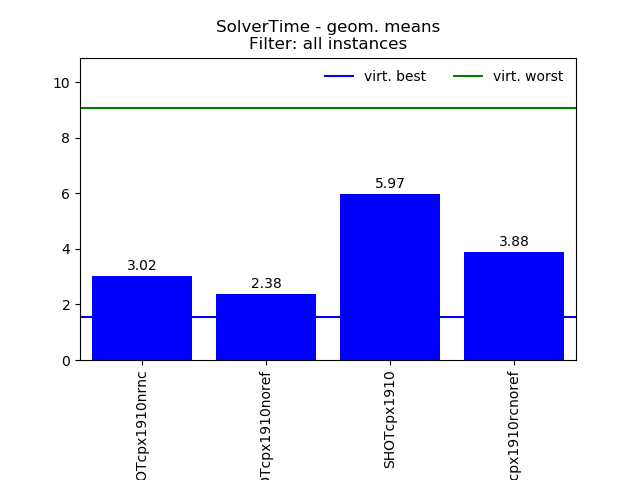
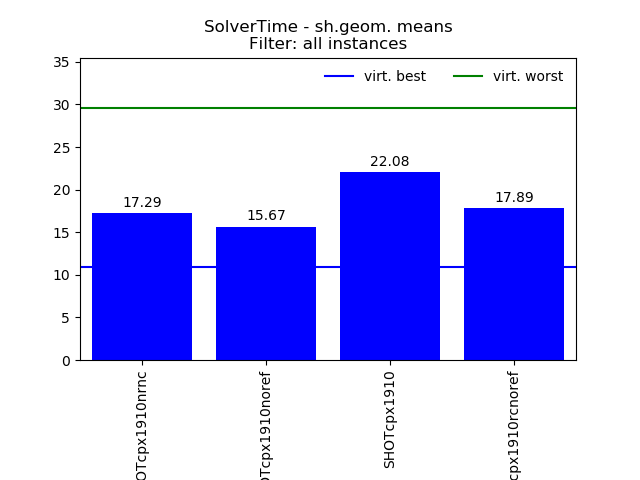
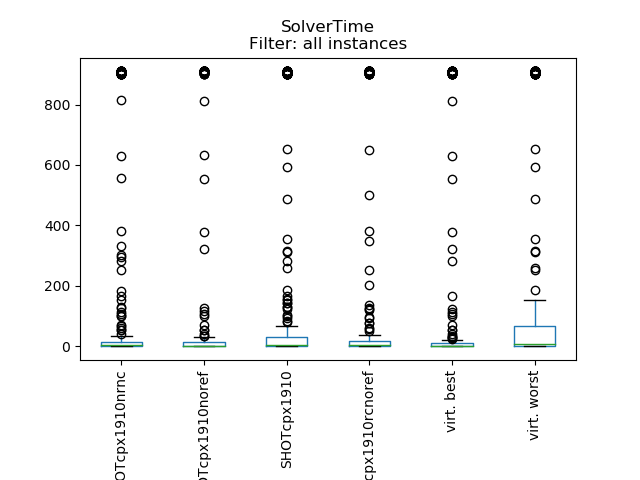
SolverTime
Filter: all instances
Attribute values were projected onto interval [0.005, 910.0].
Missing values and values for failed instances substituted by 910.0 .
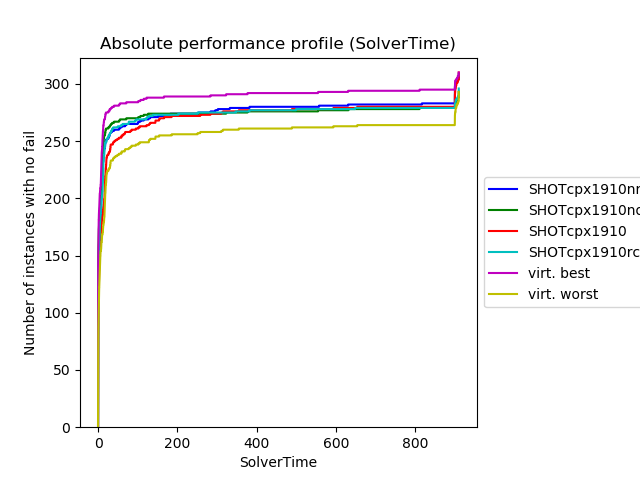
| Data | SHOTcpx1910nrnc | SHOTcpx1910noref | SHOTcpx1910 | SHOTcpx1910rcnoref | virt. best | virt. worst |
|---|---|---|---|---|---|---|
| count | 323.00 | 323.00 | 323.00 | 323.00 | 323.00 | 323.00 |
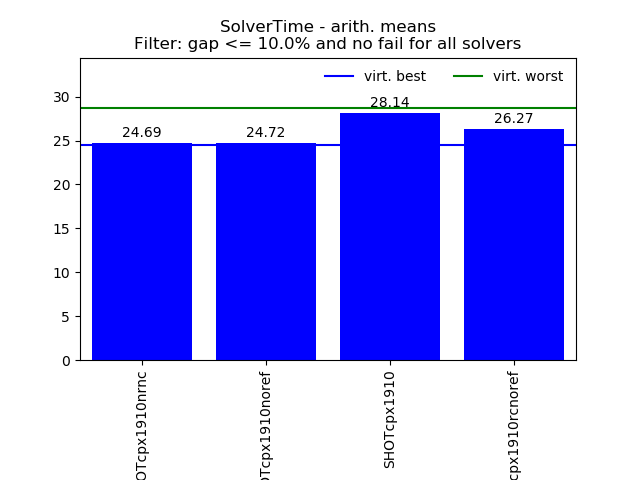
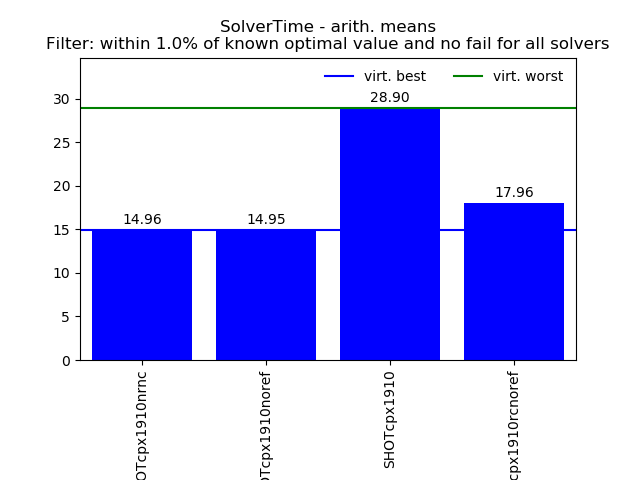
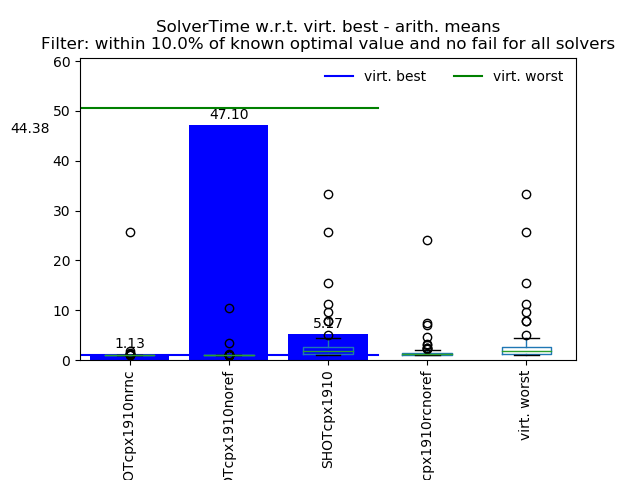
| arith. mean | 132.33 | 137.40 | 142.85 | 138.30 | 93.51 | 187.05 |
| arith. std. | 301.54 | 314.86 | 307.53 | 311.73 | 261.30 | 347.94 |
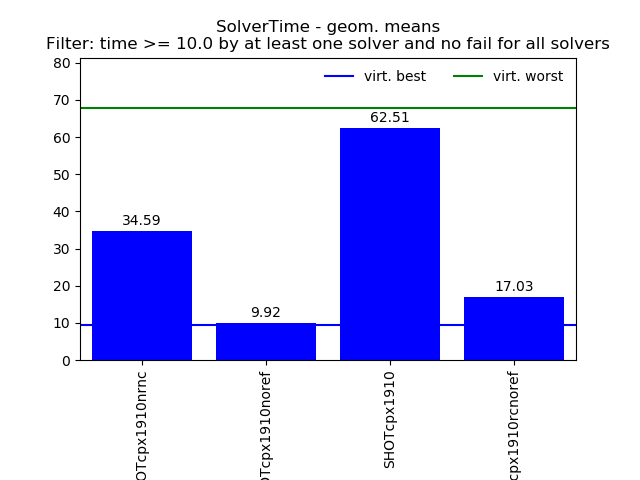
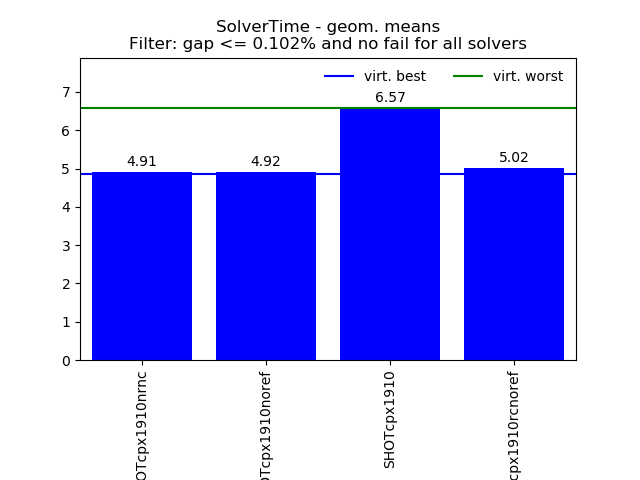
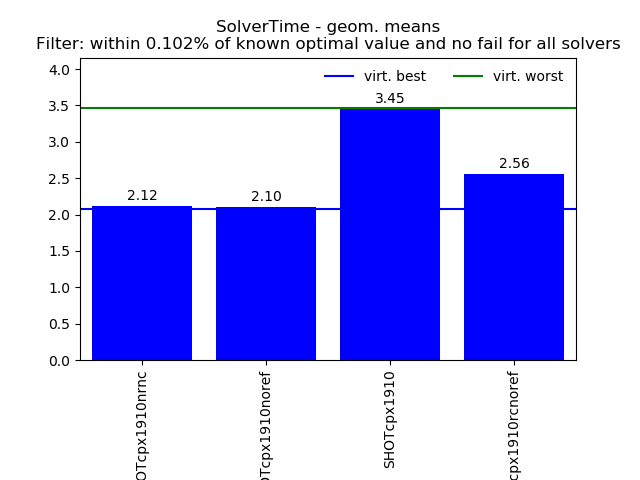
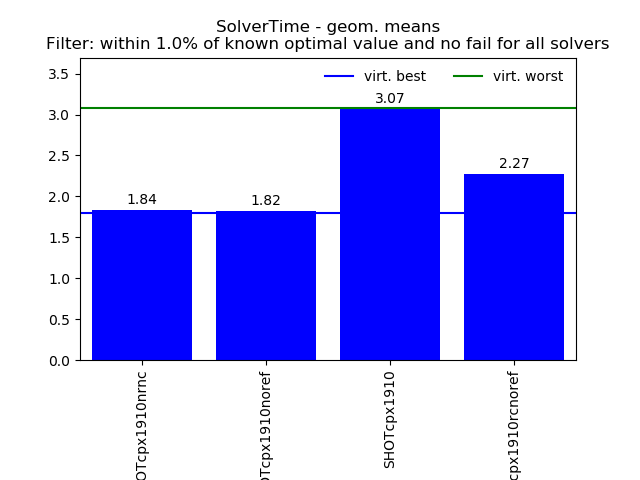
| geom. mean | 3.02 | 2.38 | 5.97 | 3.88 | 1.55 | 9.07 |
| geom. std. | 24.10 | 24.57 | 18.55 | 19.91 | 20.16 | 19.34 |
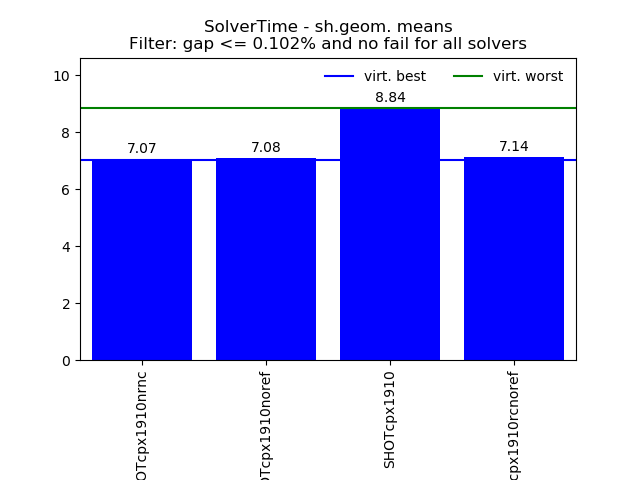
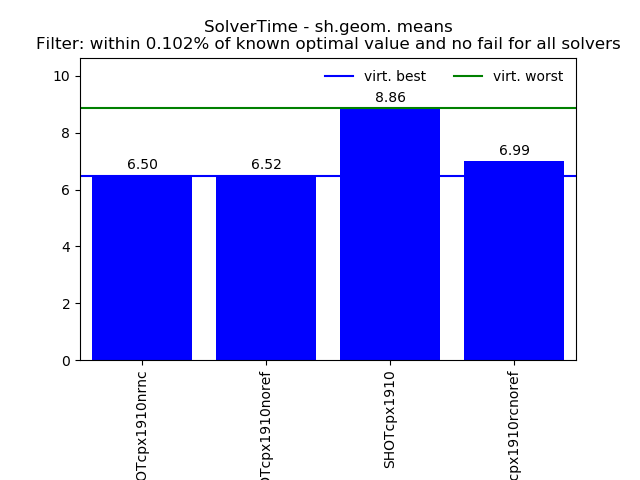
| sh.geom. mean | 17.29 | 15.67 | 22.08 | 17.89 | 10.86 | 29.58 |
| sh.geom. std. | 4.62 | 4.73 | 4.65 | 4.66 | 3.83 | 5.32 |
| min | 0.04 | 0.04 | 0.05 | 0.04 | 0.04 | 0.07 |
| 10.0% | 0.06 | 0.06 | 0.11 | 0.09 | 0.05 | 0.16 |
| 25.0% | 0.16 | 0.15 | 0.51 | 0.33 | 0.10 | 0.67 |
| 50.0% | 2.62 | 1.36 | 5.15 | 3.23 | 0.76 | 8.60 |
| 75.0% | 15.26 | 12.84 | 30.35 | 16.17 | 9.95 | 67.68 |
| 90.0% | 900.02 | 910.00 | 900.28 | 909.90 | 315.06 | 910.00 |
| max | 910.00 | 910.00 | 910.00 | 910.00 | 910.00 | 910.00 |
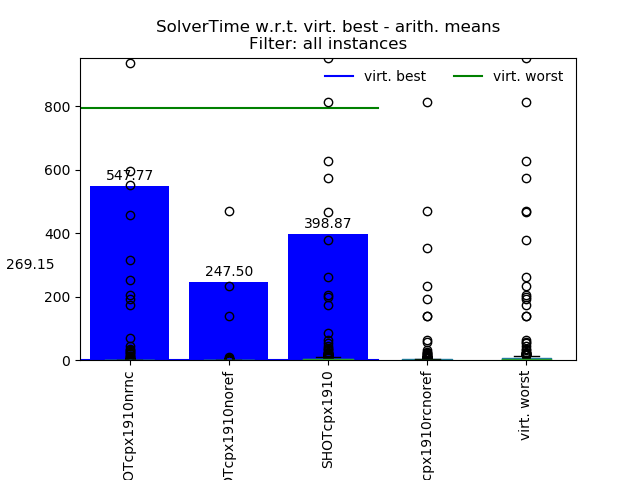
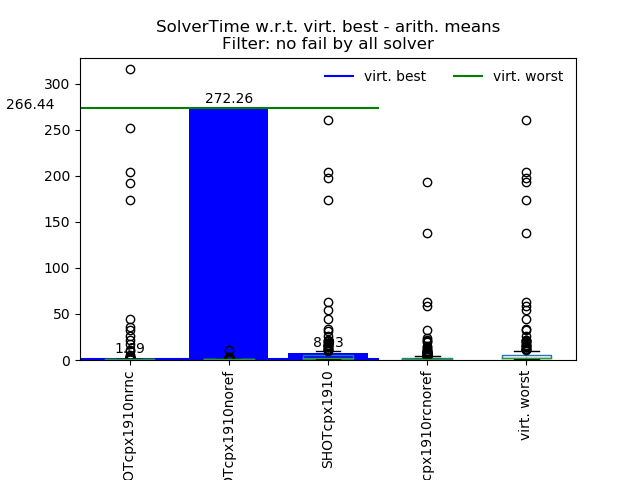
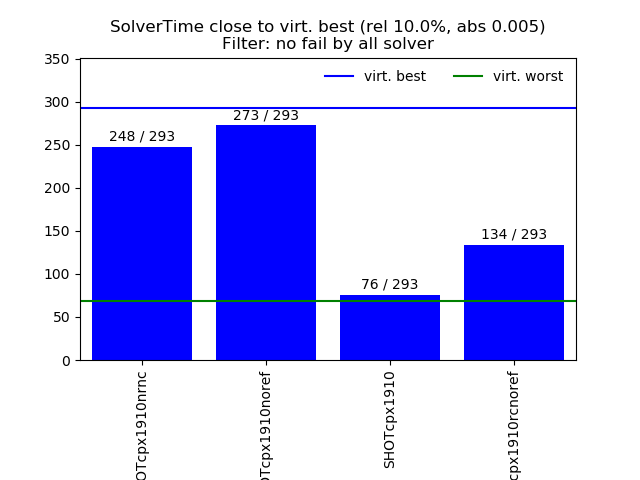
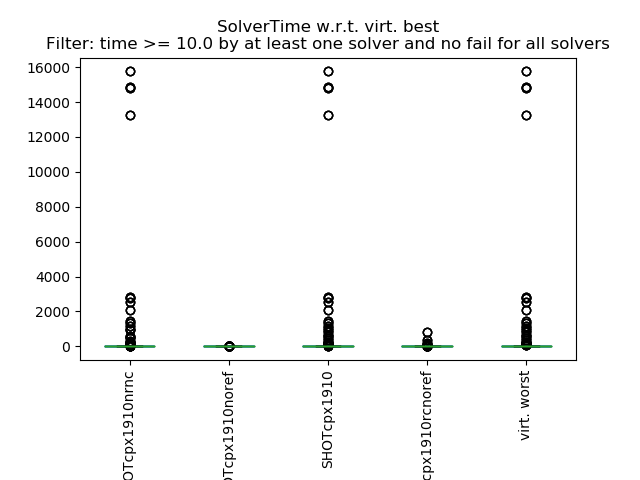
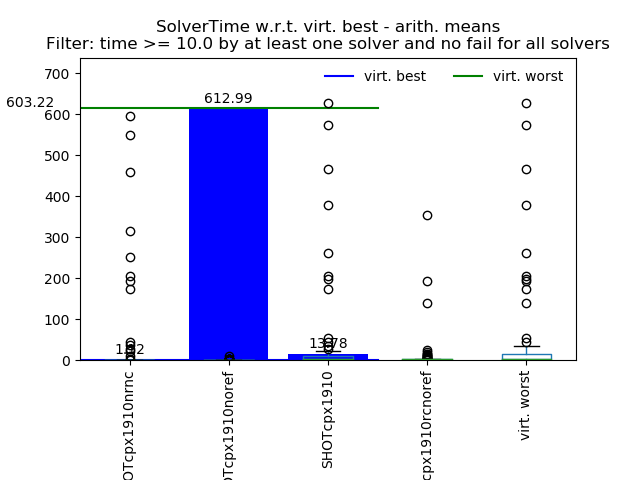
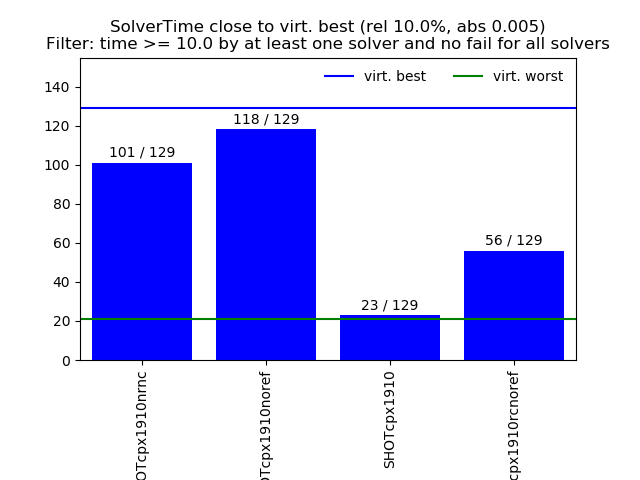
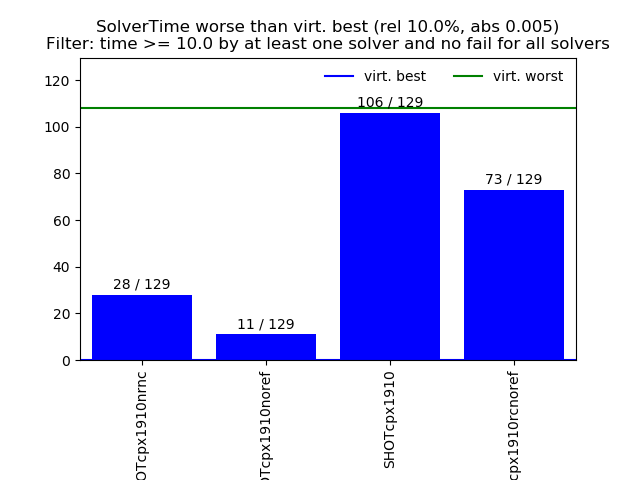
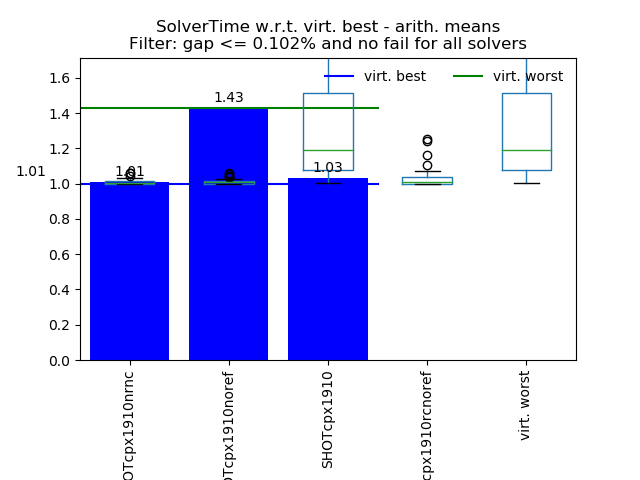
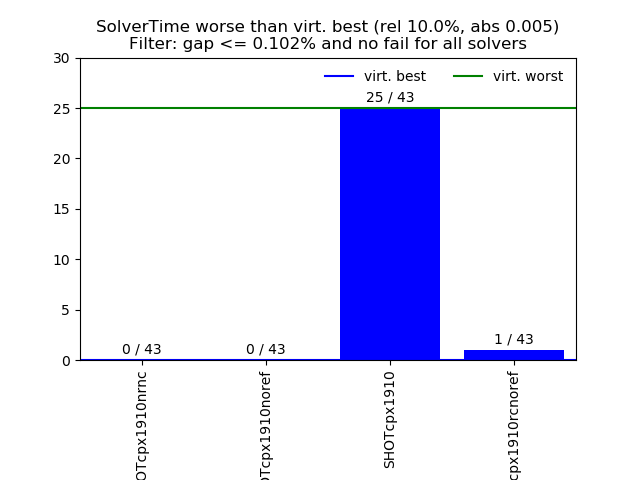
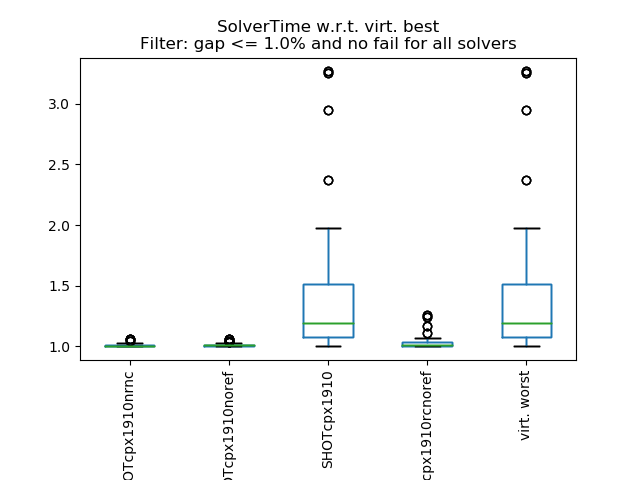
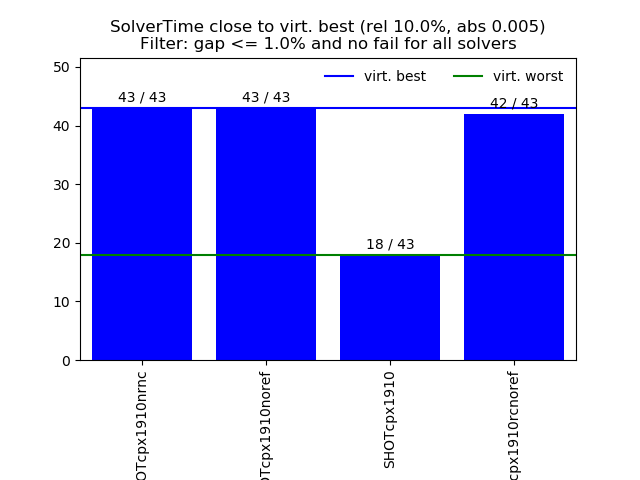
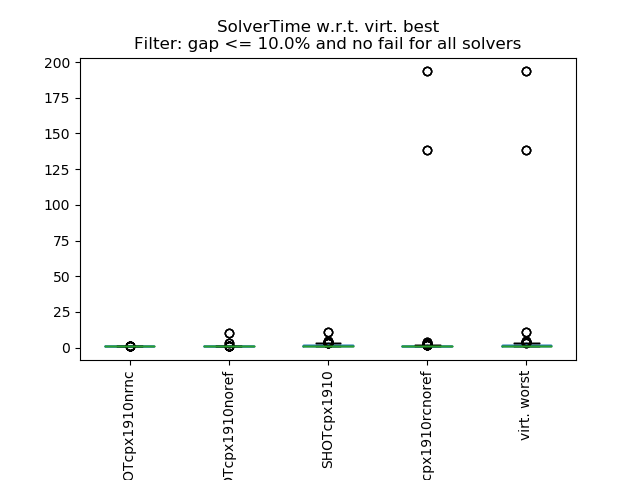
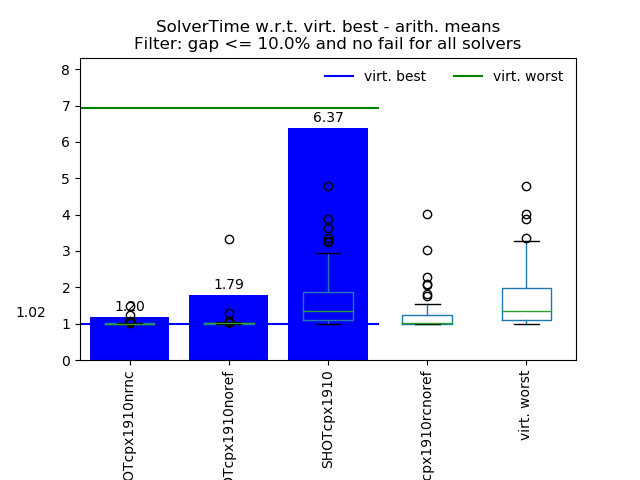
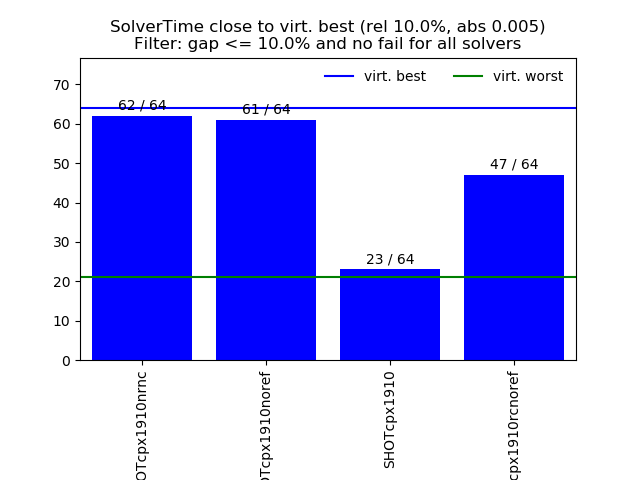
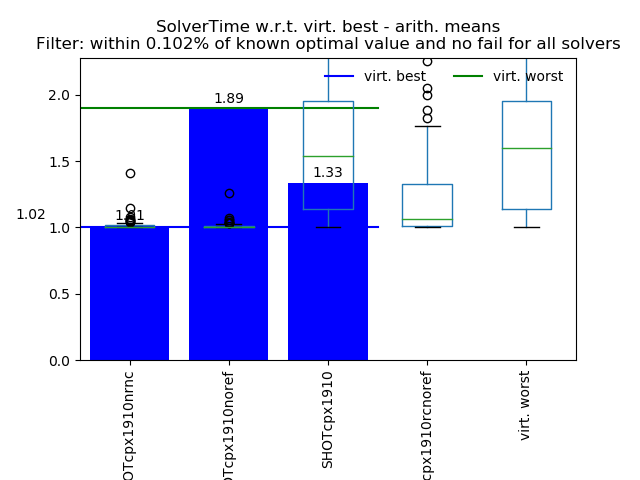
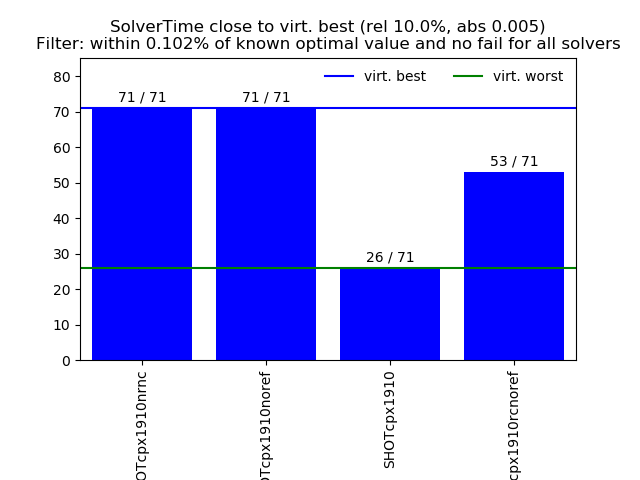
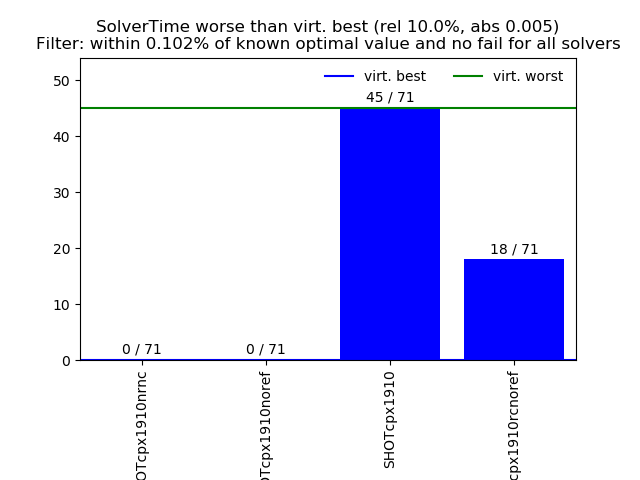
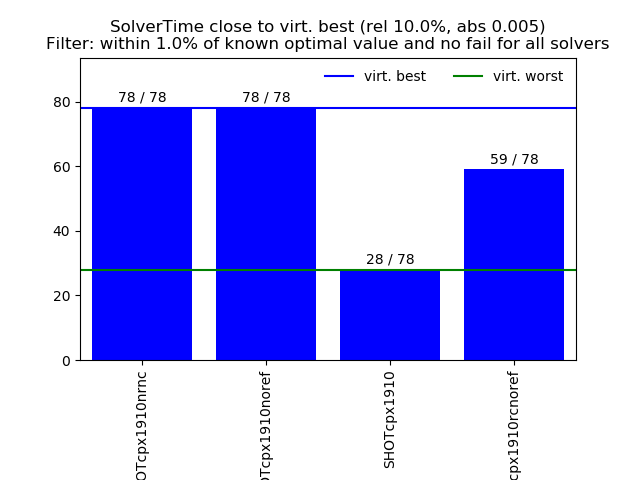
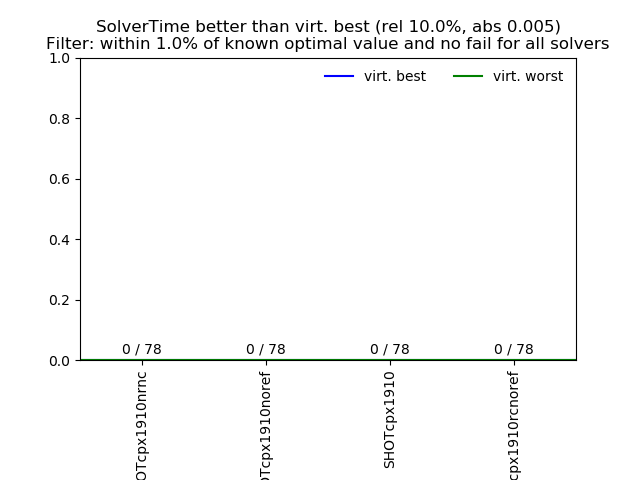
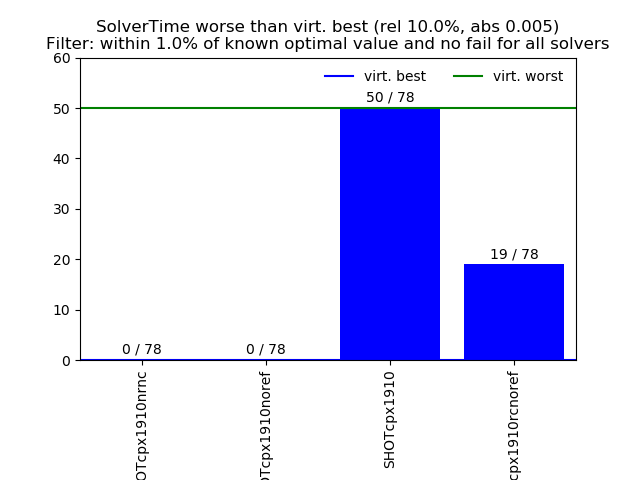
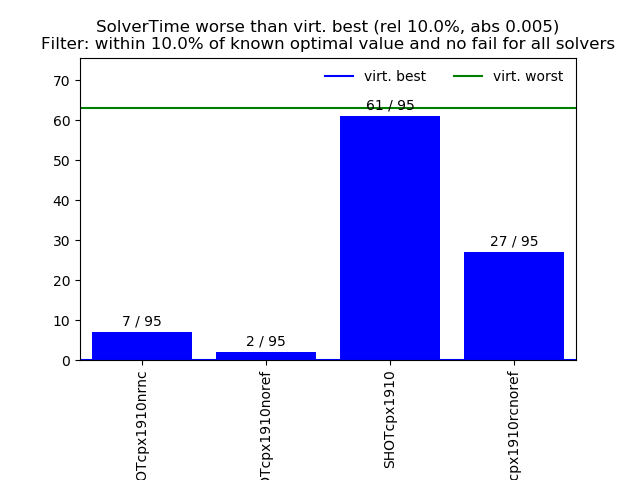
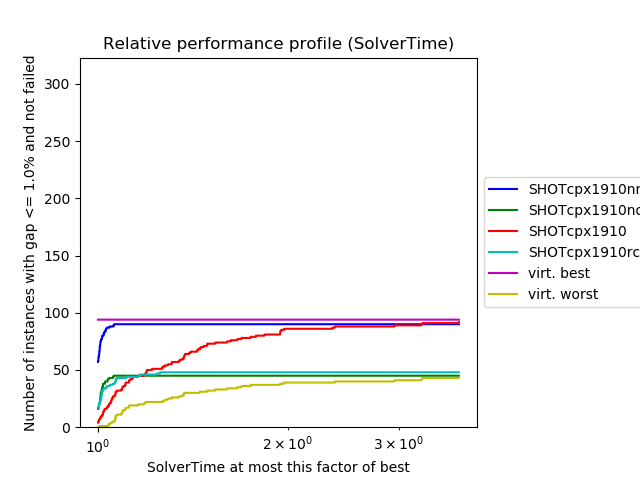
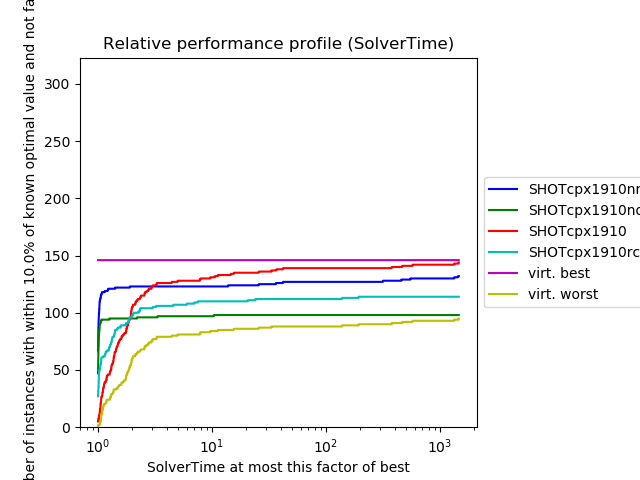
Performance with respect to virt. best:
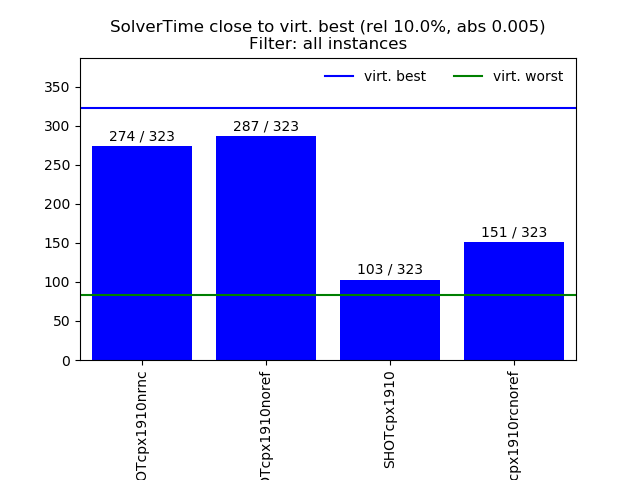
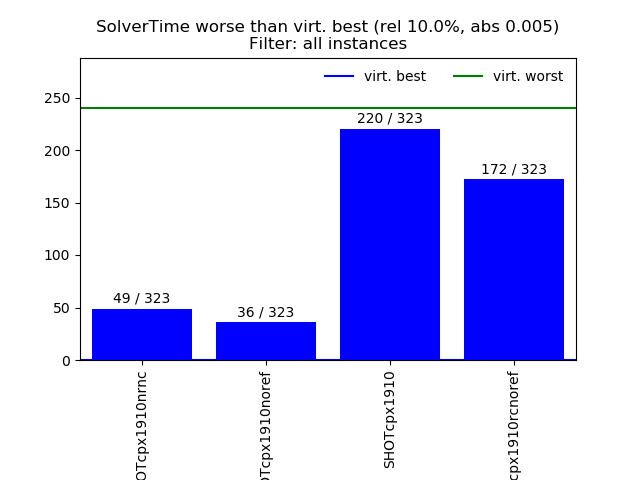
Tolerance:
relative 0.1
absolute 0.005
| Data | SHOTcpx1910nrnc | SHOTcpx1910noref | SHOTcpx1910 | SHOTcpx1910rcnoref | virt. worst |
|---|---|---|---|---|---|
| count | 323.00 | 323.00 | 323.00 | 323.00 | 323.00 |
| arith. mean | 269.15 | 547.77 | 247.50 | 398.87 | 795.14 |
| arith. std. | 1720.18 | 3147.31 | 1654.21 | 2702.43 | 3517.19 |
| min | 1.00 | 1.00 | 1.00 | 1.00 | 1.00 |
| 10.0% | 1.00 | 1.00 | 1.01 | 1.00 | 1.05 |
| 25.0% | 1.00 | 1.00 | 1.38 | 1.05 | 1.60 |
| 50.0% | 1.00 | 1.00 | 2.14 | 1.45 | 2.37 |
| 75.0% | 1.05 | 1.02 | 4.58 | 2.52 | 6.33 |
| 90.0% | 8.94 | 1.30 | 20.27 | 7.49 | 203.30 |
| max | 15763.99 | 24863.93 | 15763.85 | 24863.93 | 24863.93 |
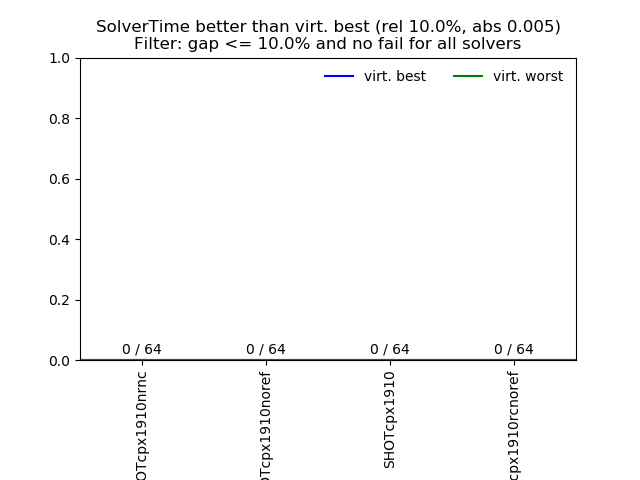
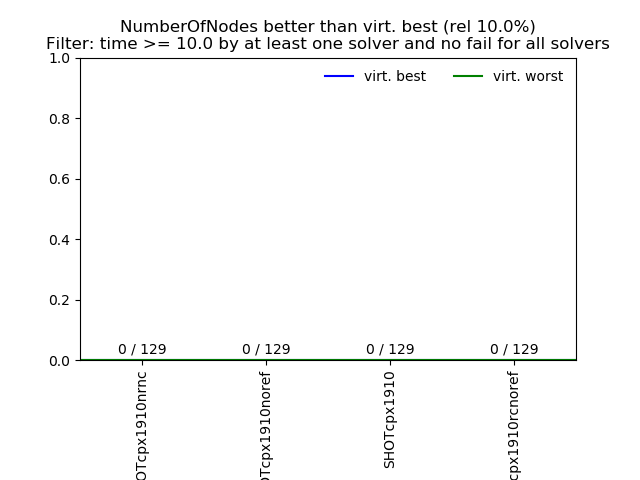
| better | 0.00 | 0.00 | 0.00 | 0.00 | 0.00 |
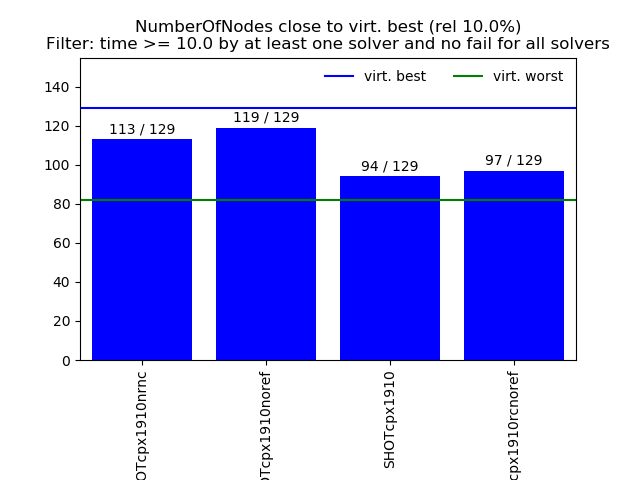
| close | 274.00 | 287.00 | 103.00 | 151.00 | 83.00 |
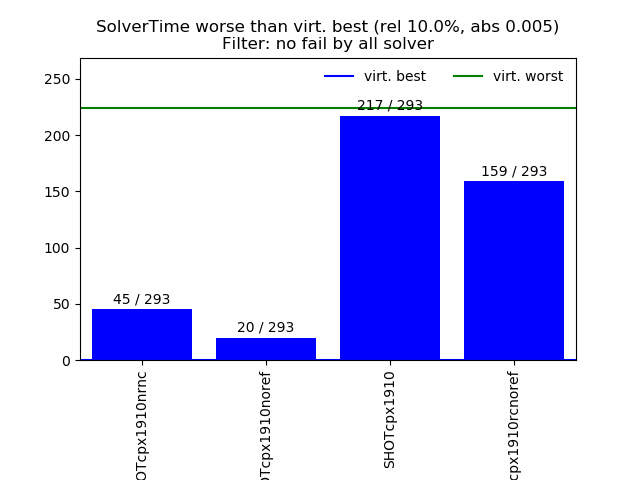
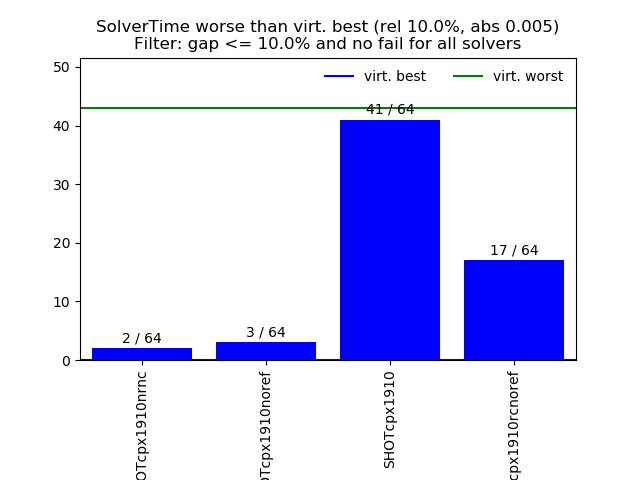
| worse | 49.00 | 36.00 | 220.00 | 172.00 | 240.00 |