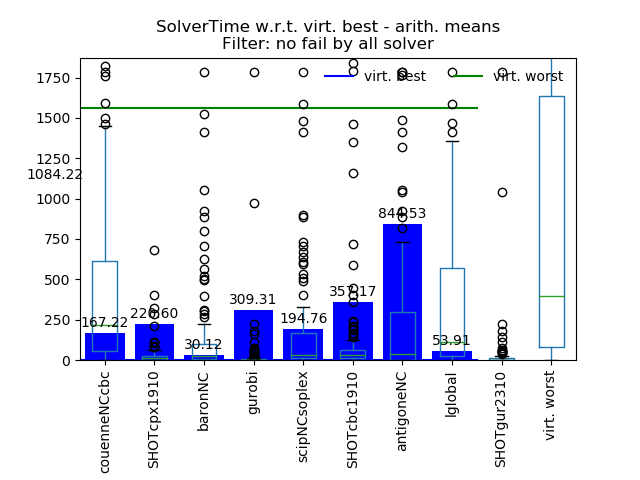
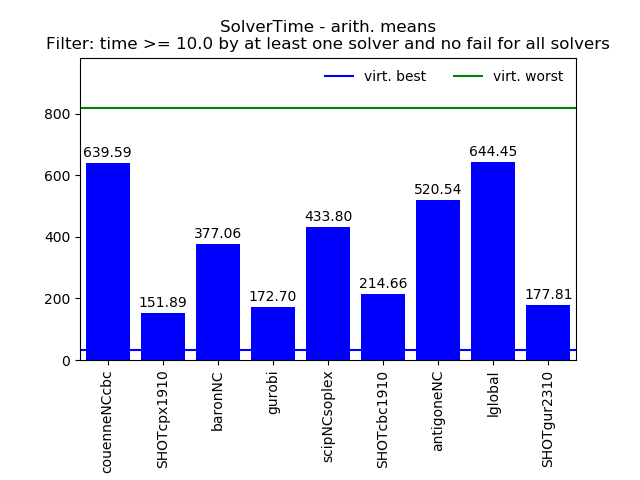
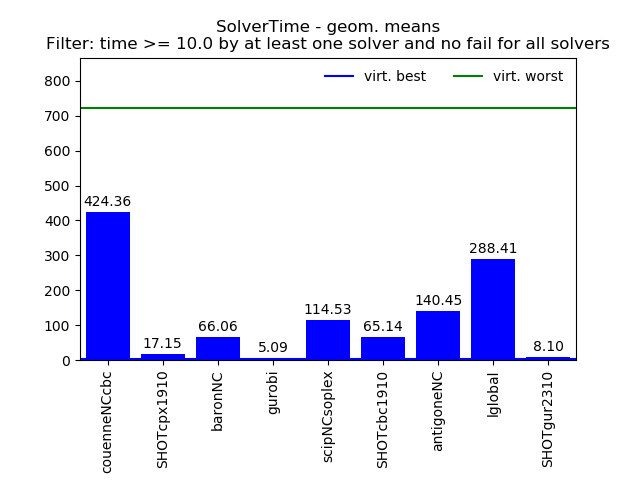
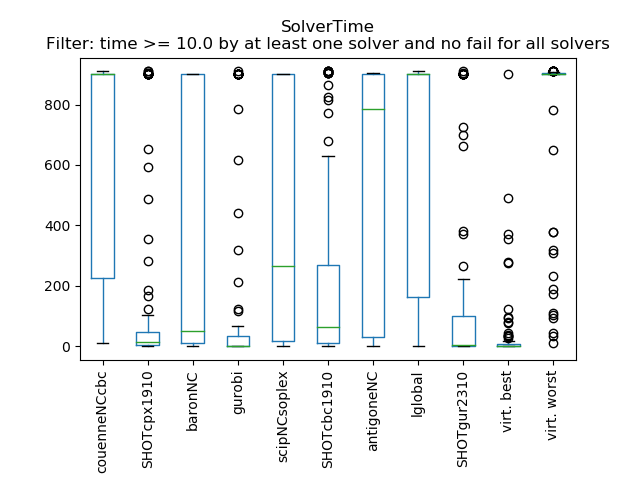
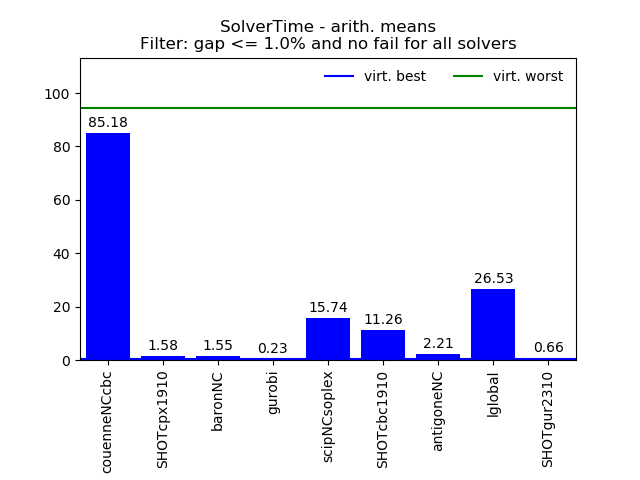
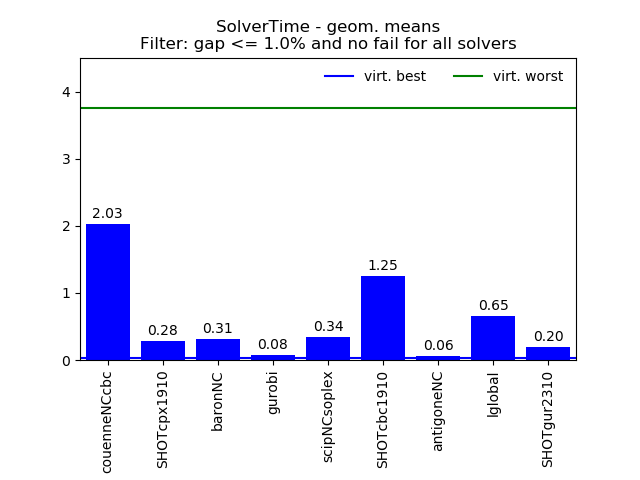
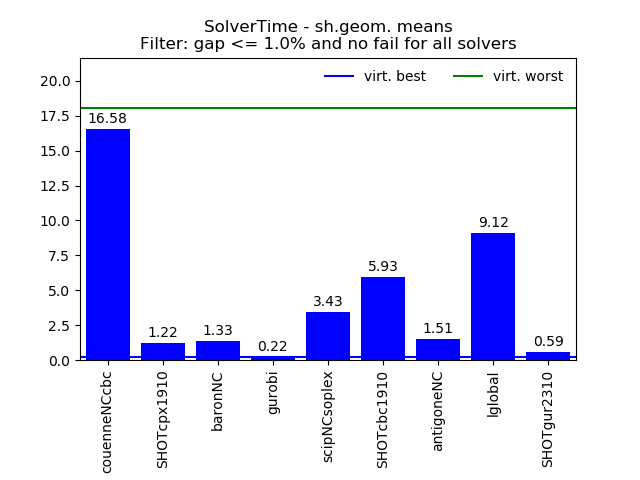
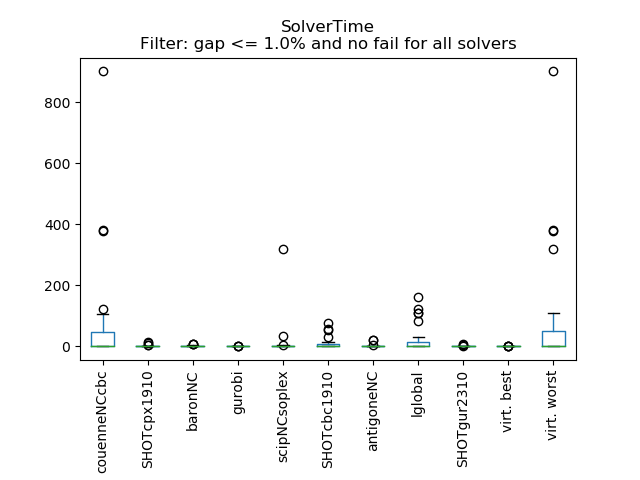
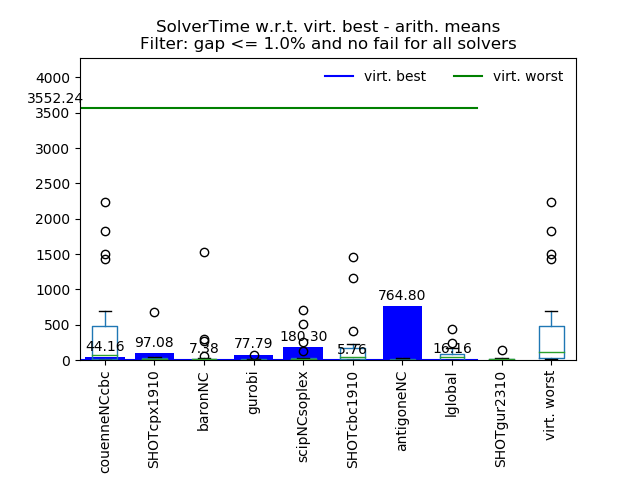
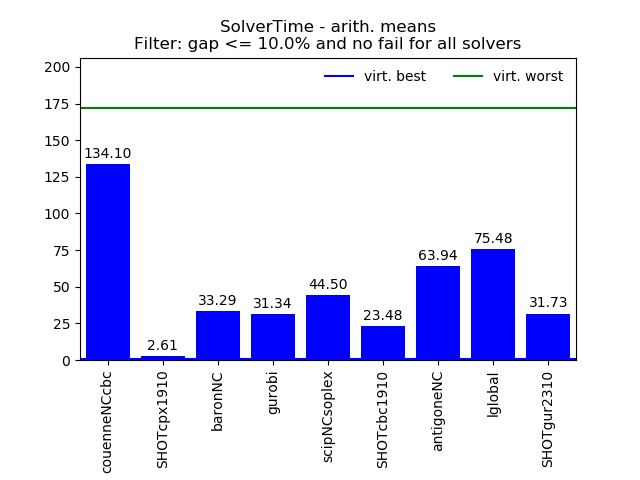
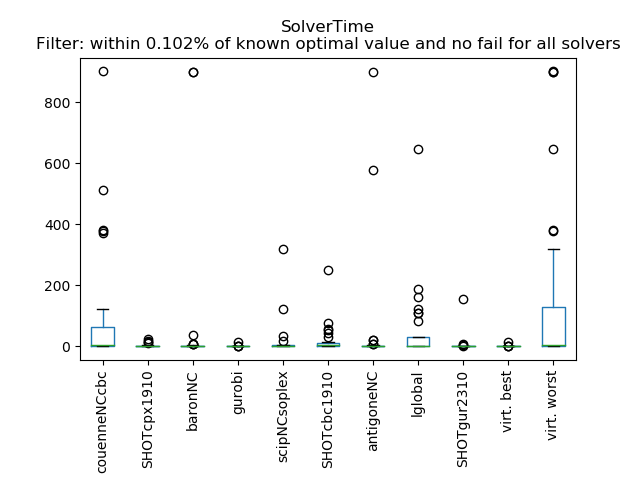
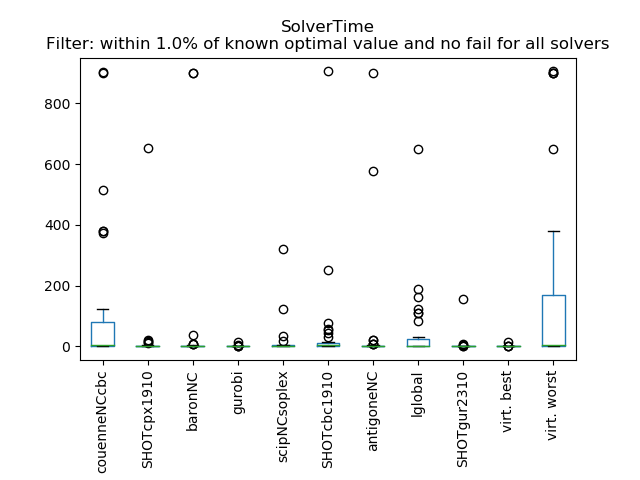
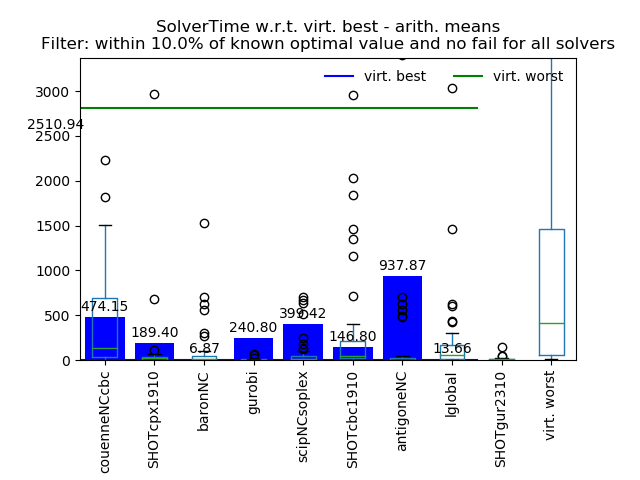
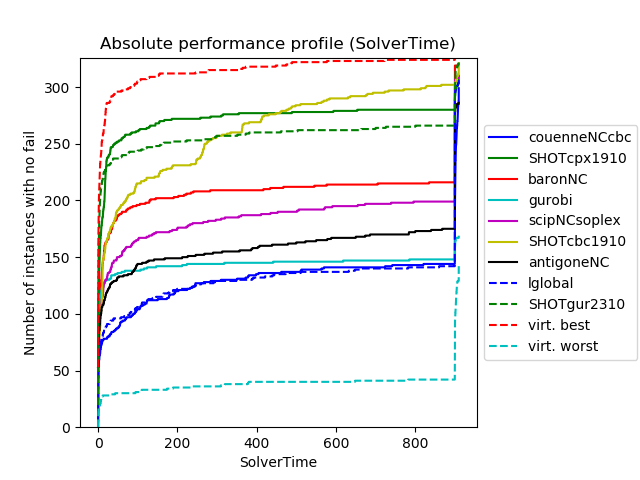
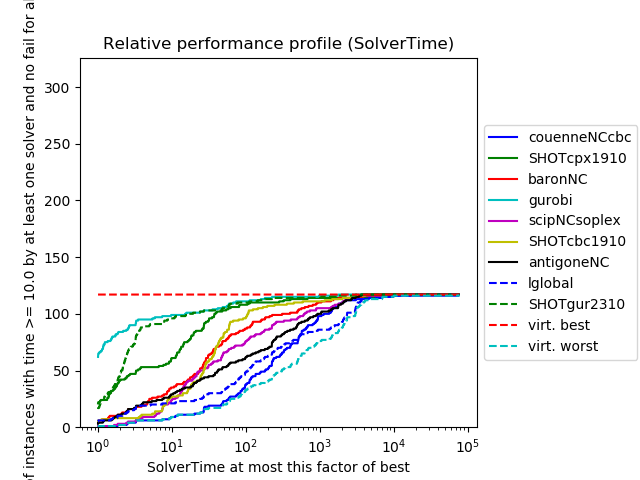
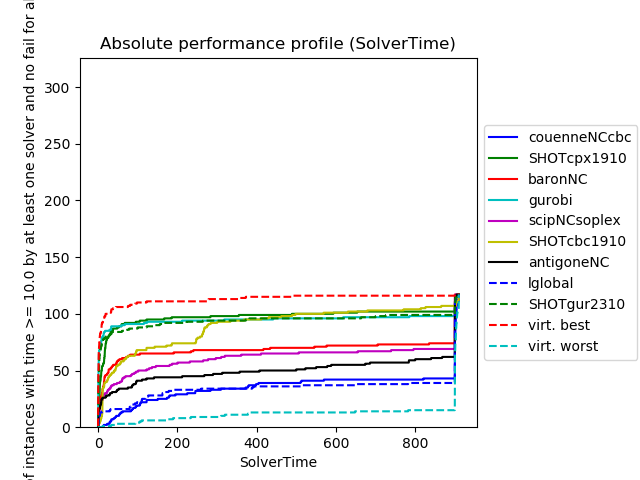
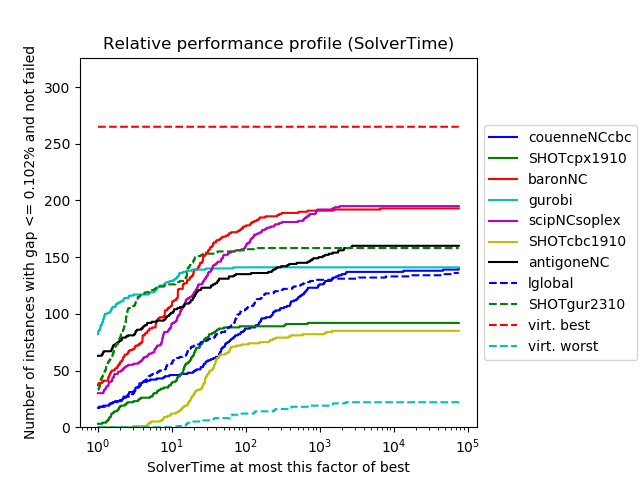
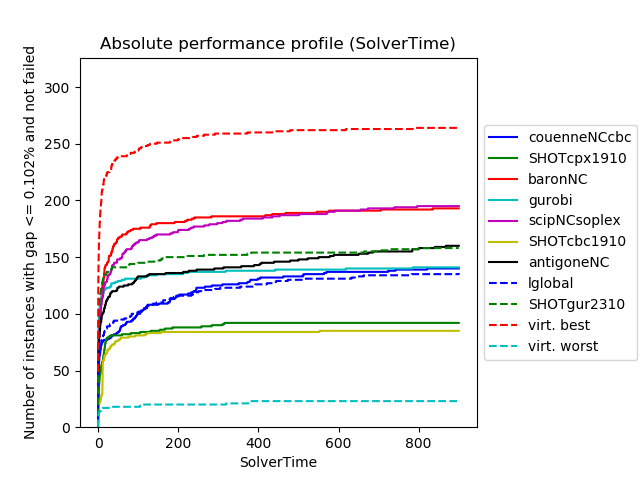
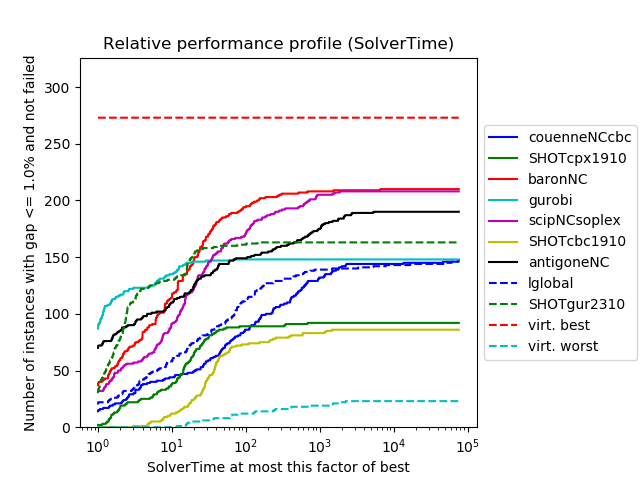
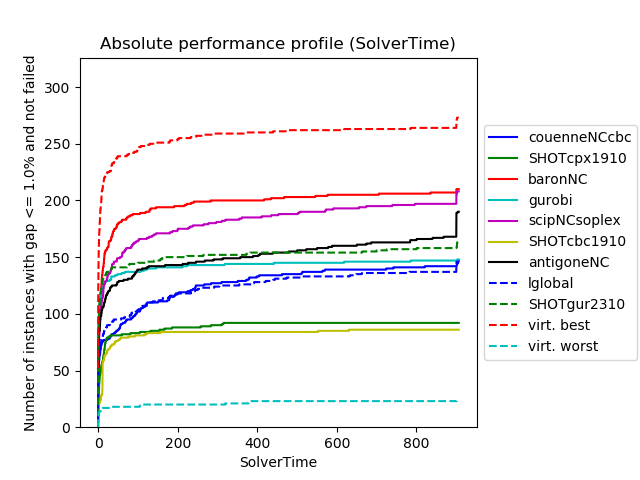
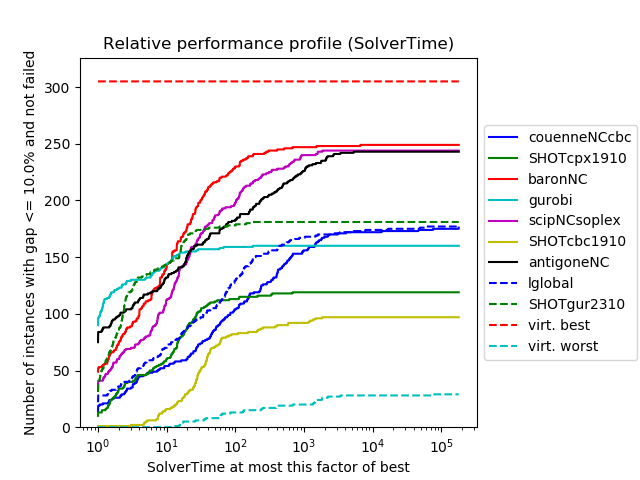
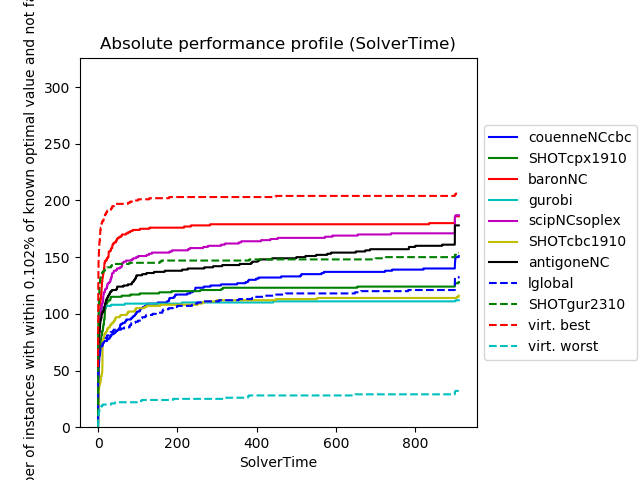
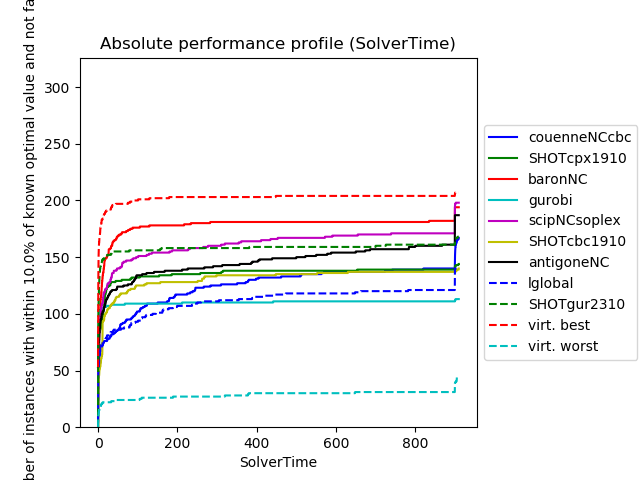
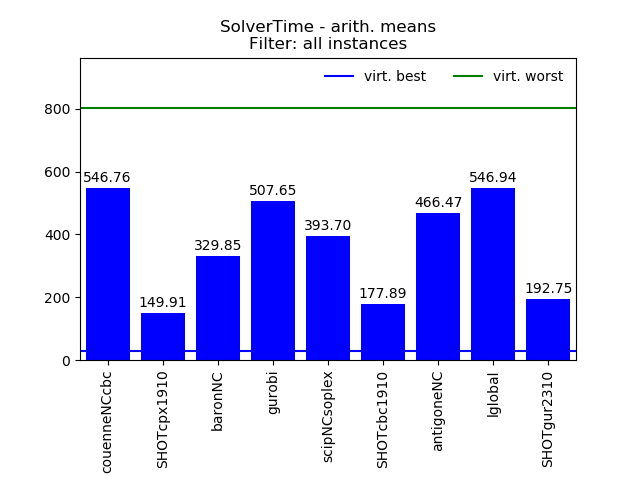
SolverTime
Filter: all instances
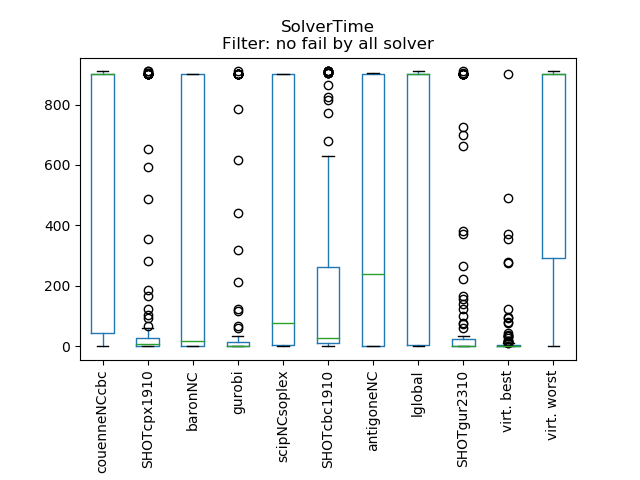
Attribute values were projected onto interval [0.005, 910.0].
Missing values and values for failed instances substituted by 910.0 .
| Data | couenneNCcbc | SHOTcpx1910 | baronNC | gurobi | scipNCsoplex | SHOTcbc1910 | antigoneNC | lglobal | SHOTgur2310 | virt. best | virt. worst |
|---|---|---|---|---|---|---|---|---|---|---|---|
| count | 326.00 | 326.00 | 326.00 | 326.00 | 326.00 | 326.00 | 326.00 | 326.00 | 326.00 | 326.00 | 326.00 |
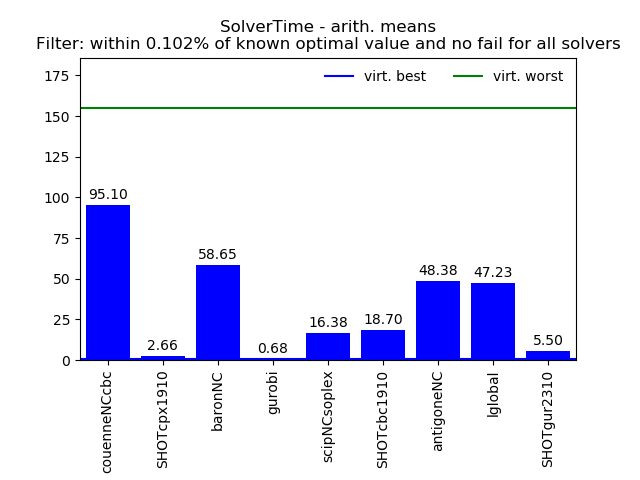
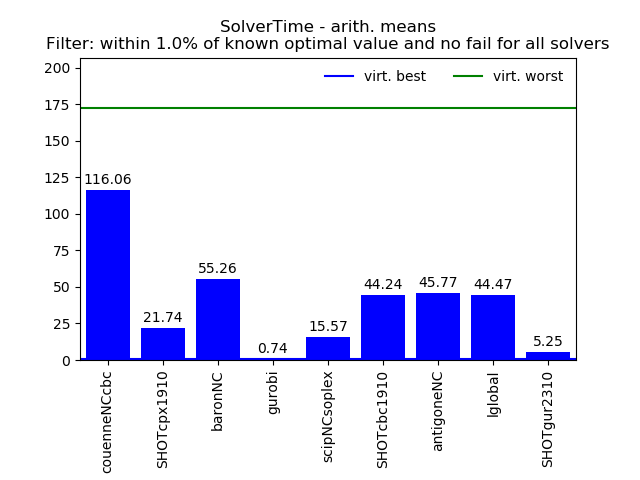
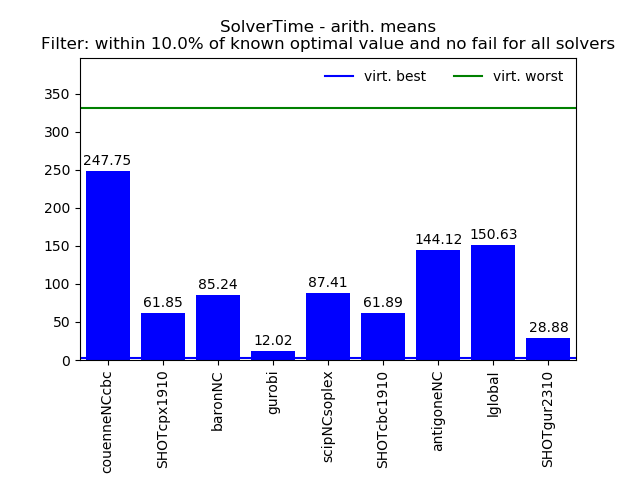
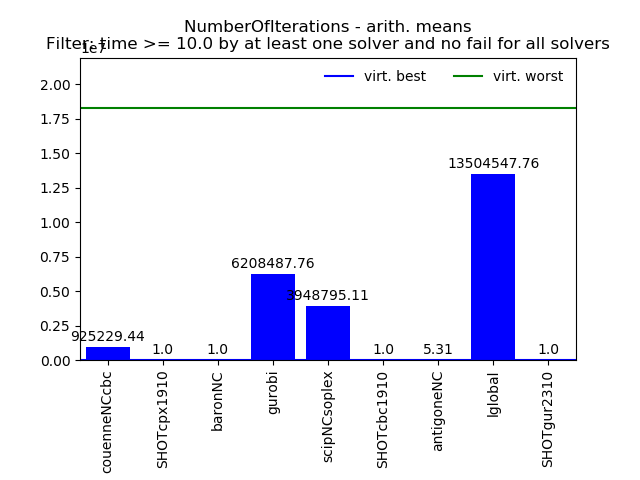
| arith. mean | 546.76 | 149.91 | 329.85 | 507.65 | 393.70 | 177.89 | 466.47 | 546.94 | 192.75 | 30.14 | 802.38 |
| arith. std. | 416.39 | 314.77 | 417.74 | 445.61 | 422.76 | 276.79 | 430.08 | 418.85 | 351.96 | 109.62 | 280.71 |
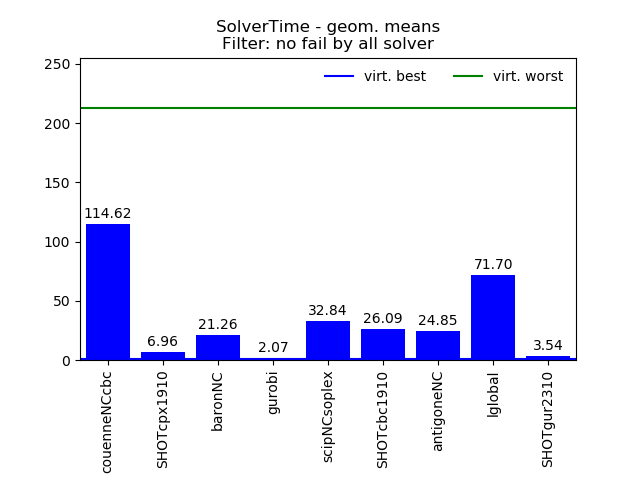
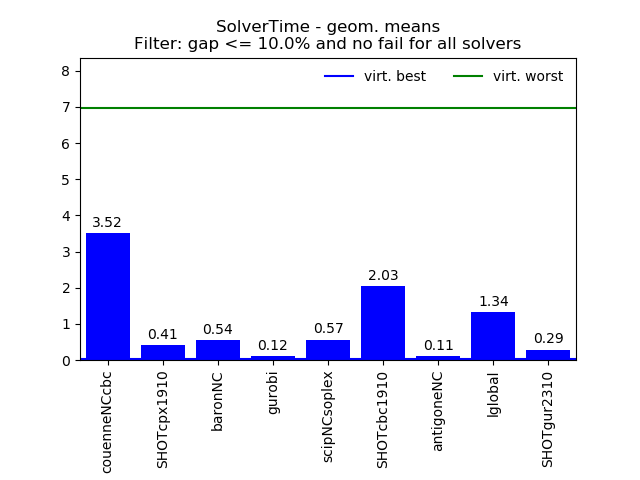
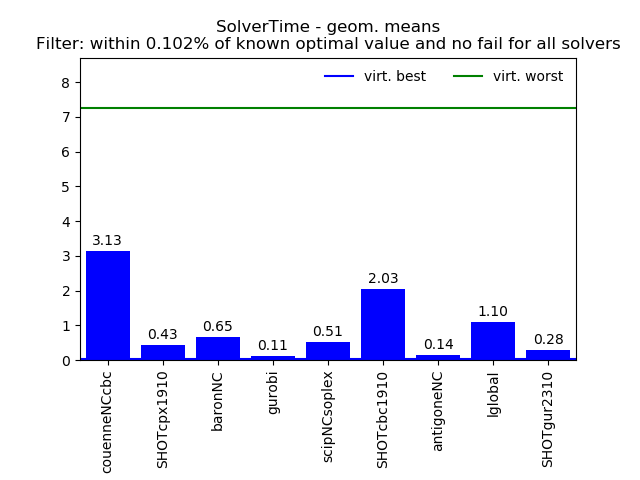
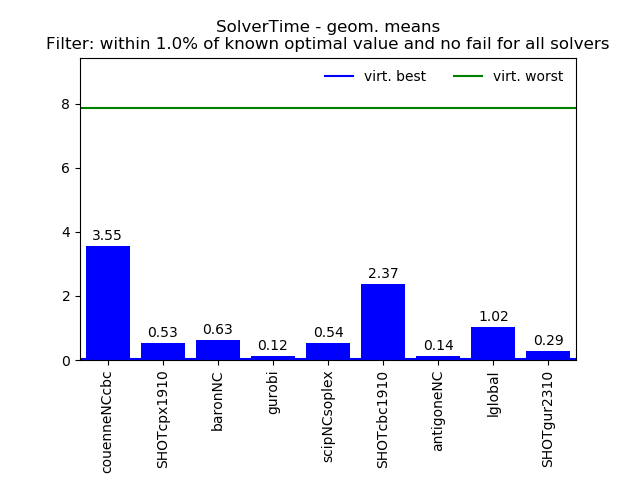
| geom. mean | 94.41 | 6.25 | 19.19 | 39.58 | 34.74 | 20.75 | 29.67 | 90.21 | 4.64 | 0.82 | 478.90 |
| geom. std. | 31.51 | 19.03 | 34.73 | 45.90 | 35.07 | 15.53 | 84.46 | 30.17 | 26.92 | 22.83 | 7.01 |
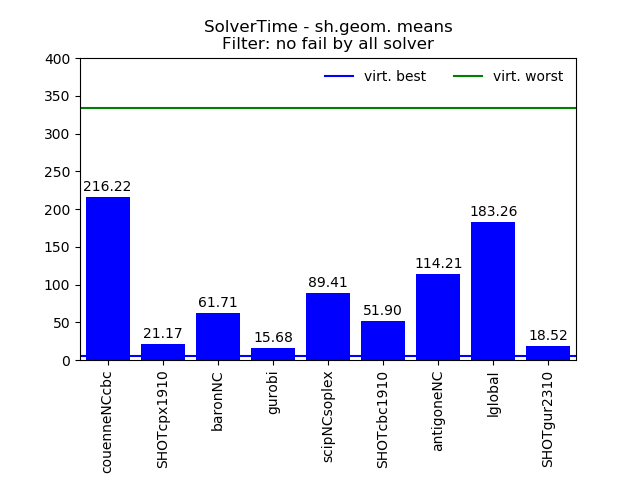
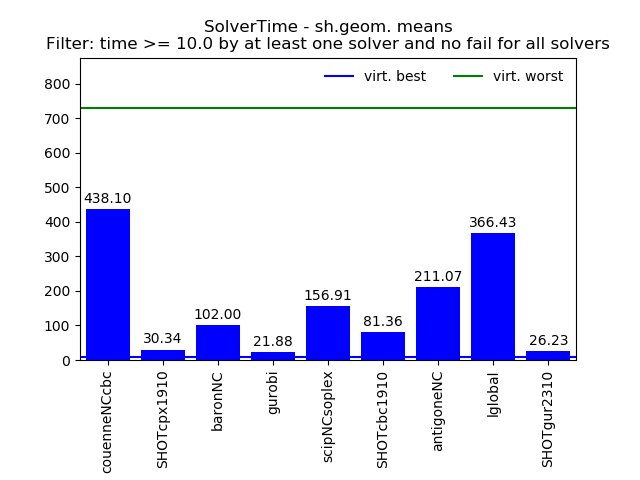
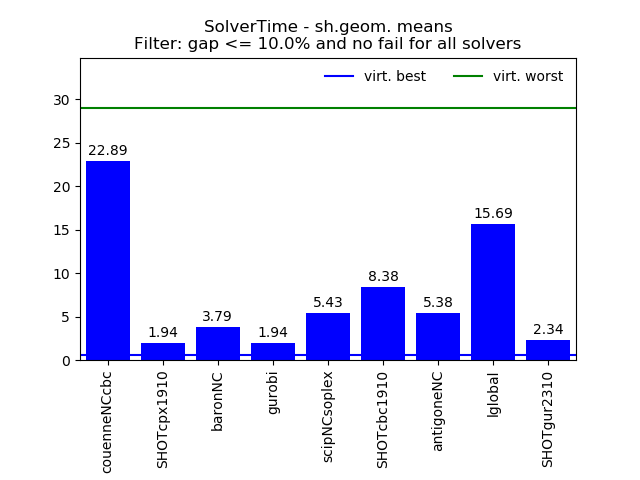
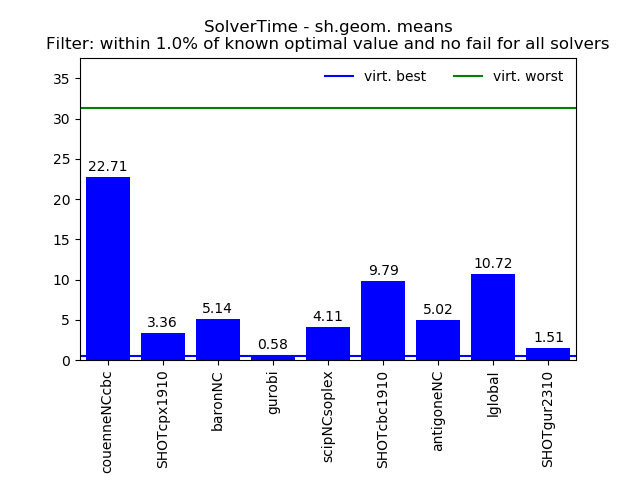
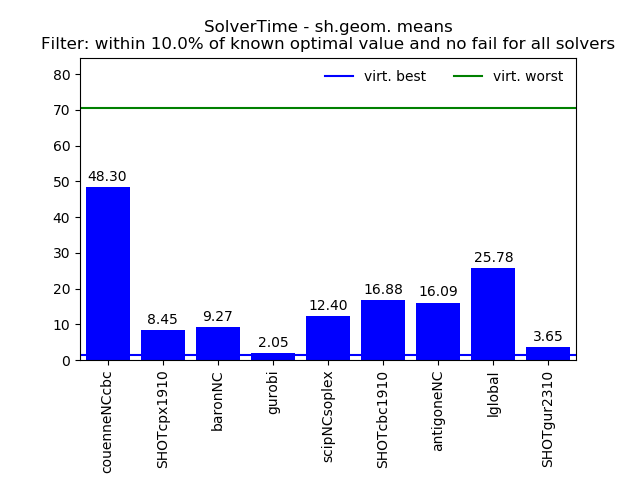
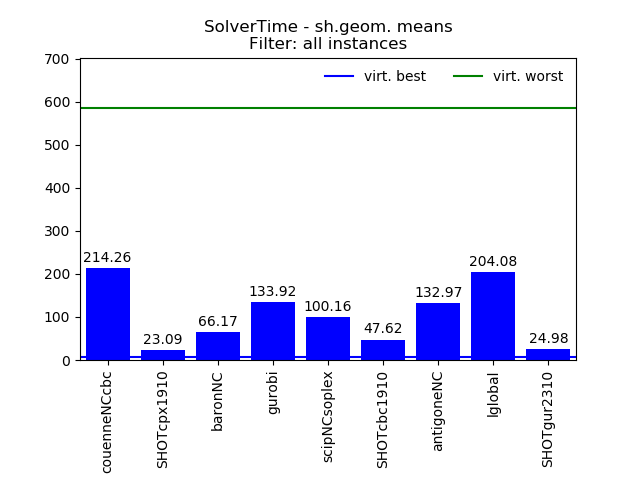
| sh.geom. mean | 214.26 | 23.09 | 66.17 | 133.92 | 100.16 | 47.62 | 132.97 | 204.08 | 24.98 | 6.80 | 585.82 |
| sh.geom. std. | 6.27 | 4.77 | 7.04 | 8.30 | 7.05 | 4.83 | 7.40 | 6.60 | 5.94 | 2.52 | 3.43 |
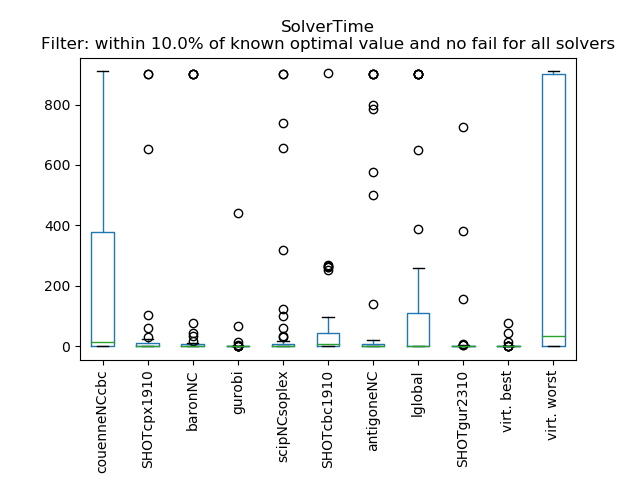
| min | 0.01 | 0.05 | 0.01 | 0.01 | 0.01 | 0.06 | 0.01 | 0.01 | 0.06 | 0.01 | 0.06 |
| 10.0% | 0.33 | 0.11 | 0.07 | 0.14 | 0.15 | 0.29 | 0.01 | 0.33 | 0.10 | 0.01 | 141.84 |
| 25.0% | 30.38 | 0.53 | 1.39 | 0.89 | 3.08 | 3.71 | 2.01 | 11.95 | 0.34 | 0.13 | 900.18 |
| 50.0% | 900.05 | 5.44 | 20.05 | 900.82 | 89.91 | 20.53 | 511.50 | 900.02 | 1.83 | 0.86 | 910.00 |
| 75.0% | 902.56 | 31.28 | 900.00 | 910.00 | 900.00 | 264.99 | 900.01 | 900.08 | 106.73 | 8.35 | 910.00 |
| 90.0% | 910.00 | 900.79 | 900.00 | 910.00 | 900.02 | 677.29 | 910.00 | 900.49 | 900.24 | 39.16 | 910.00 |
| max | 910.00 | 910.00 | 910.00 | 910.00 | 910.00 | 910.00 | 910.00 | 910.00 | 910.00 | 900.01 | 910.00 |


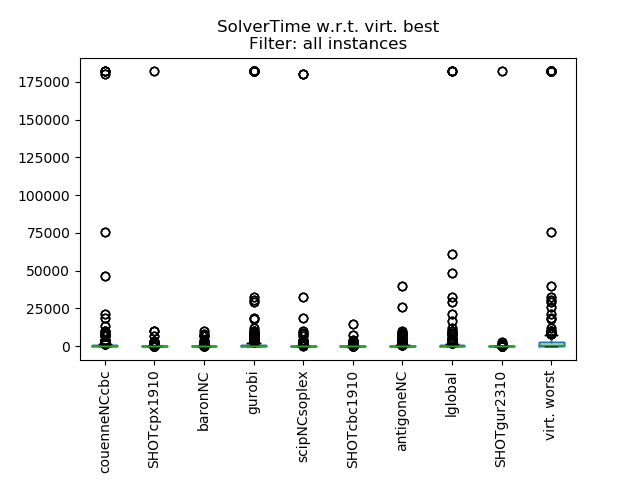
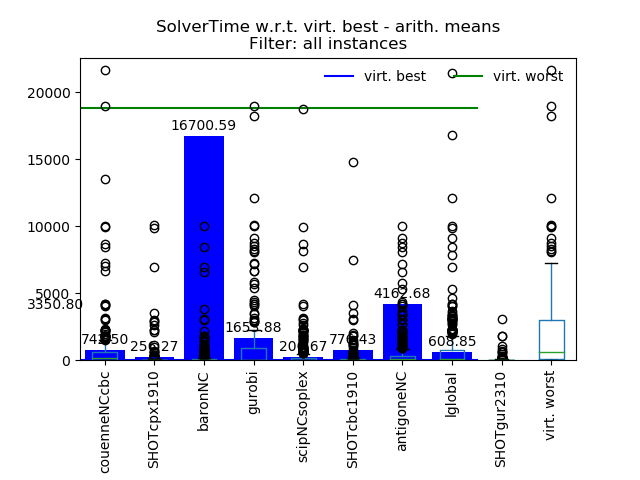
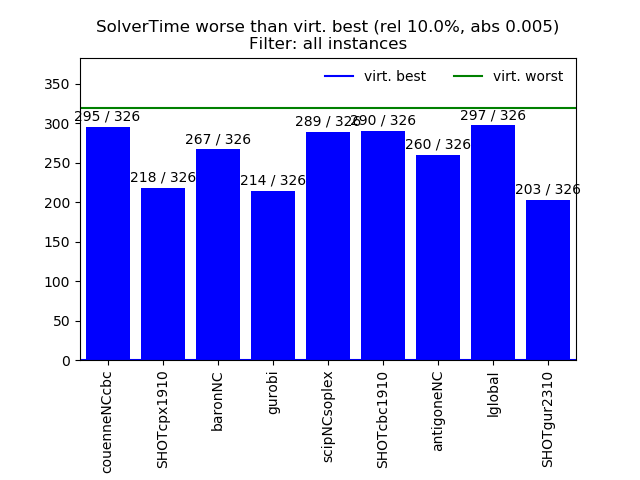
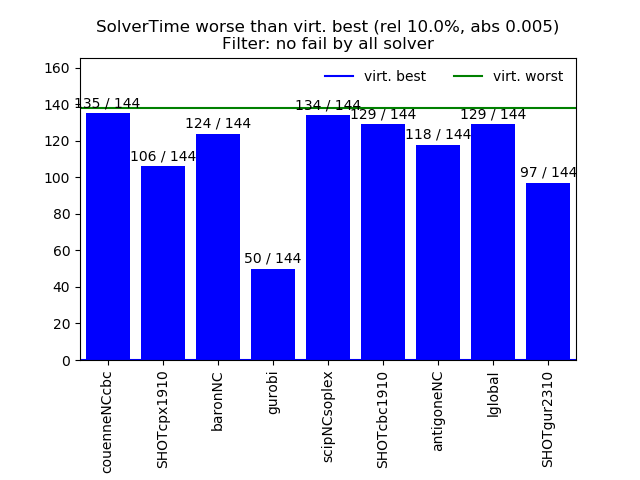
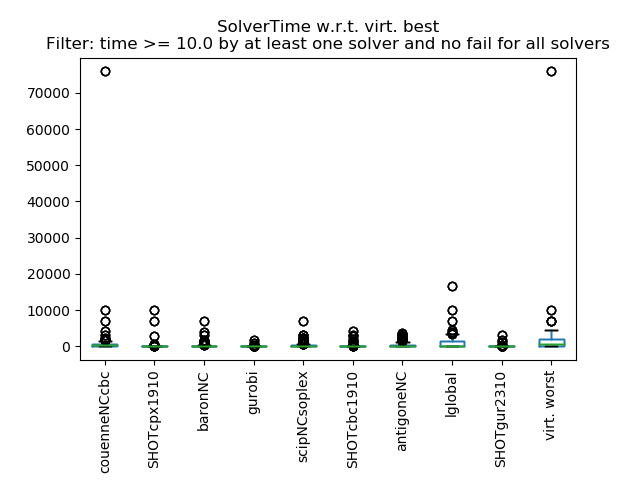
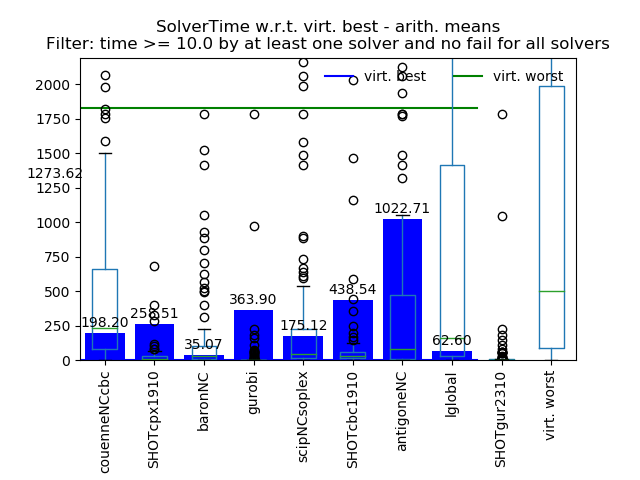
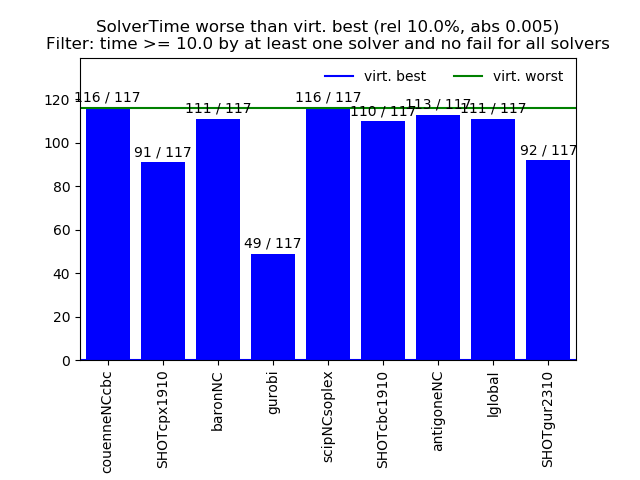
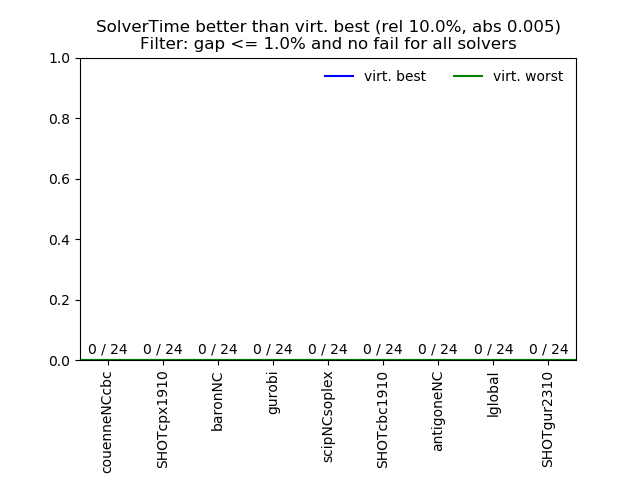
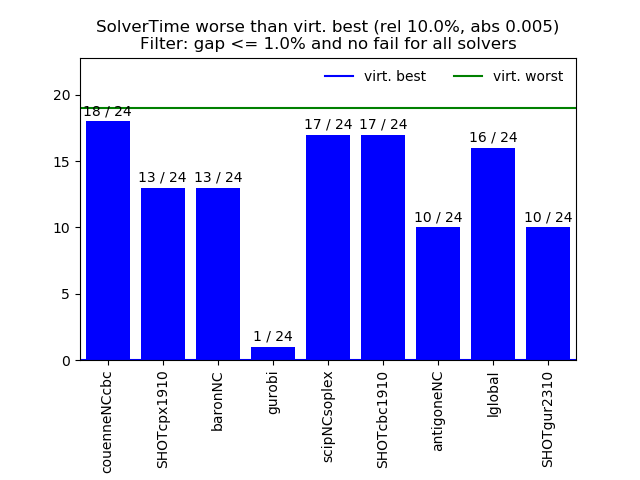
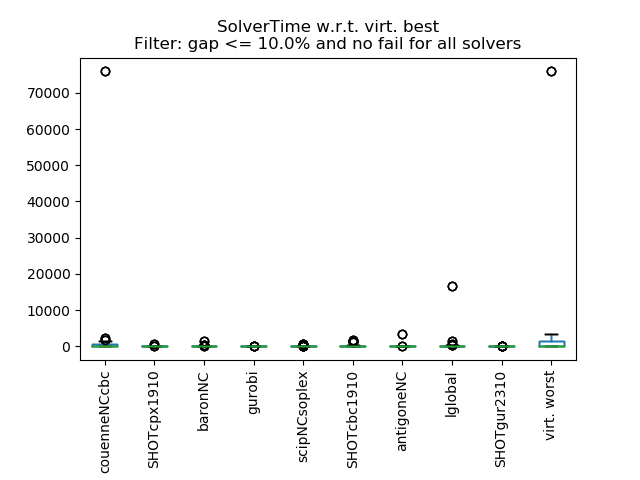
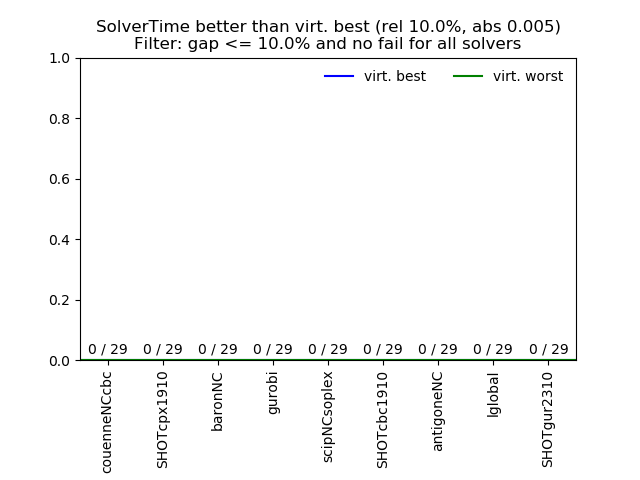
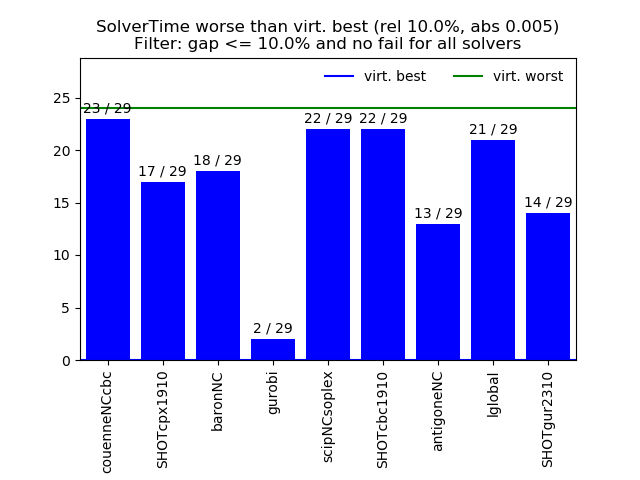
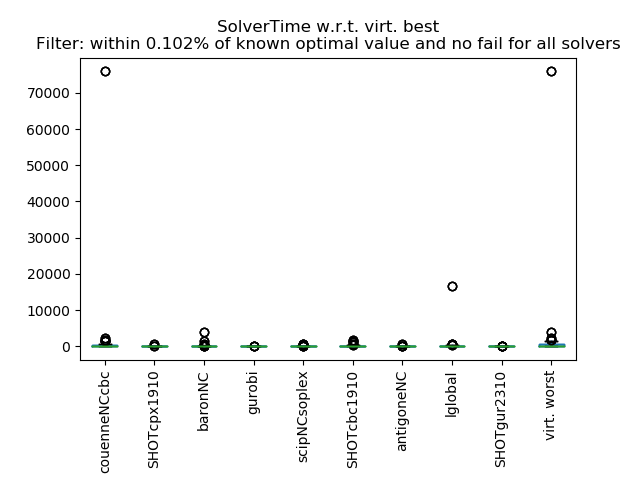
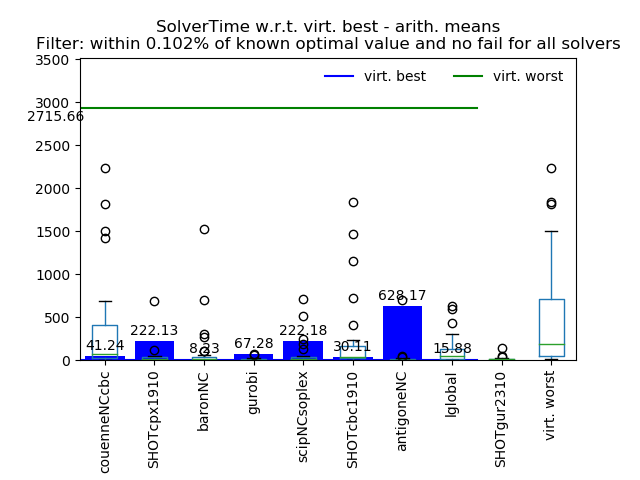
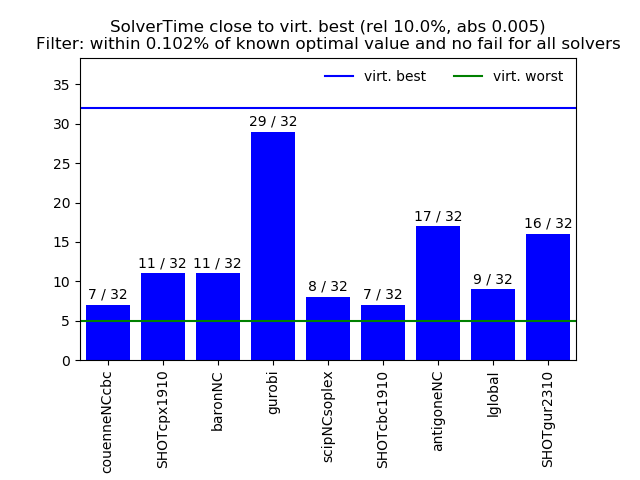
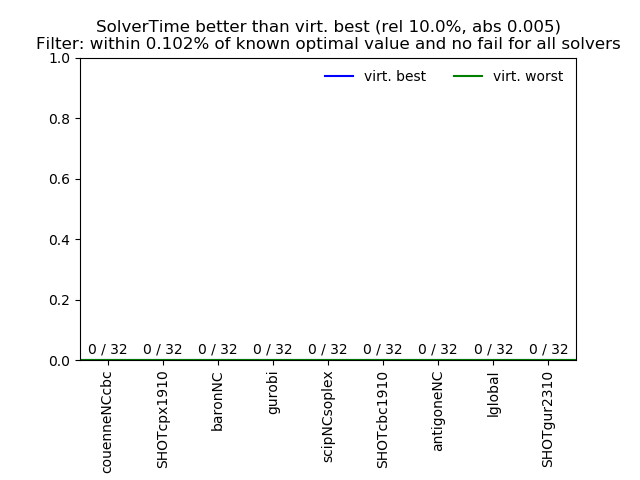
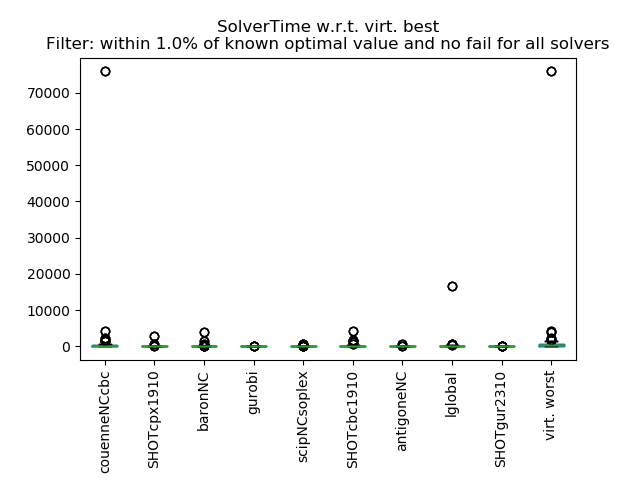
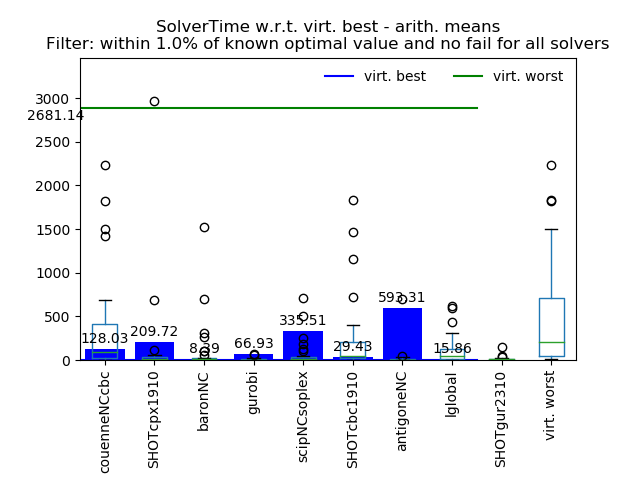
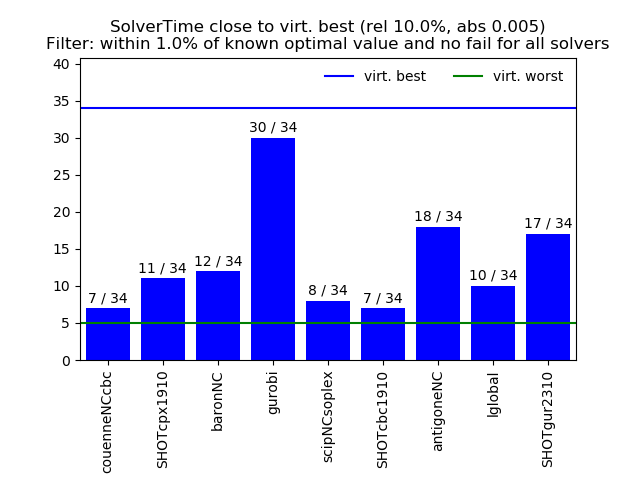
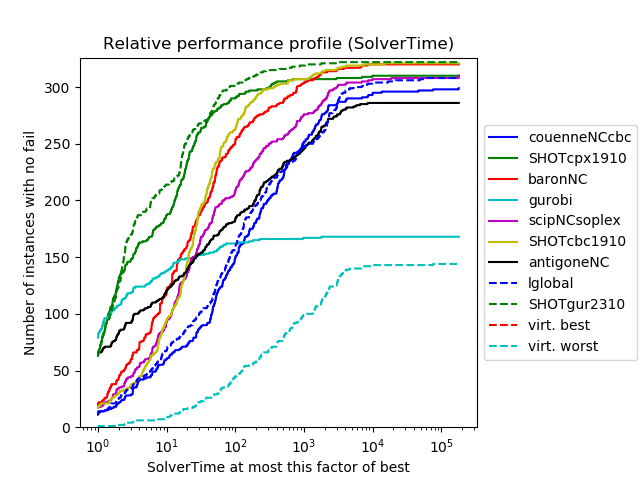
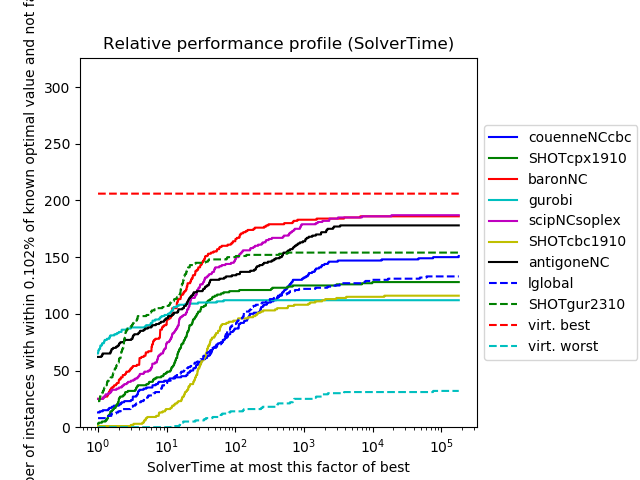
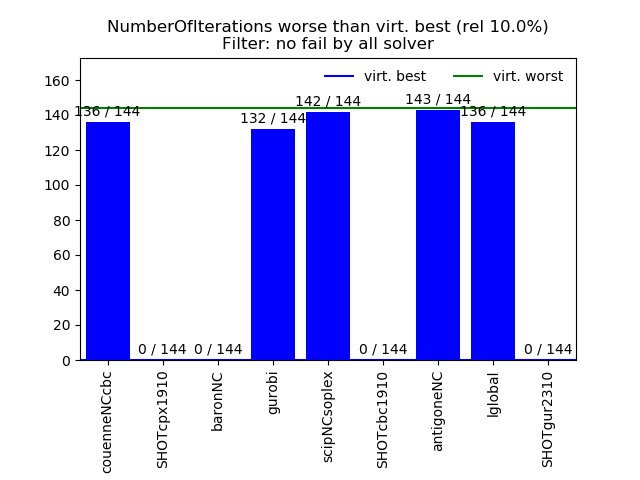
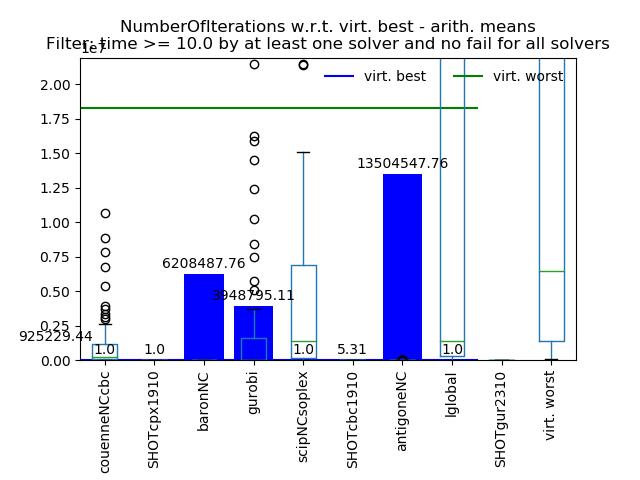
Performance with respect to virt. best:
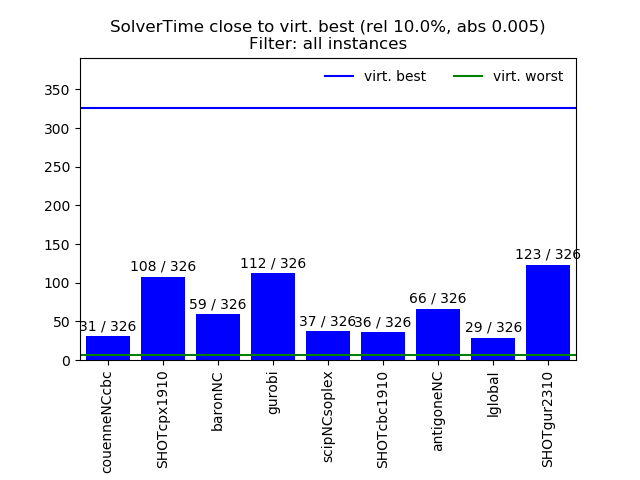
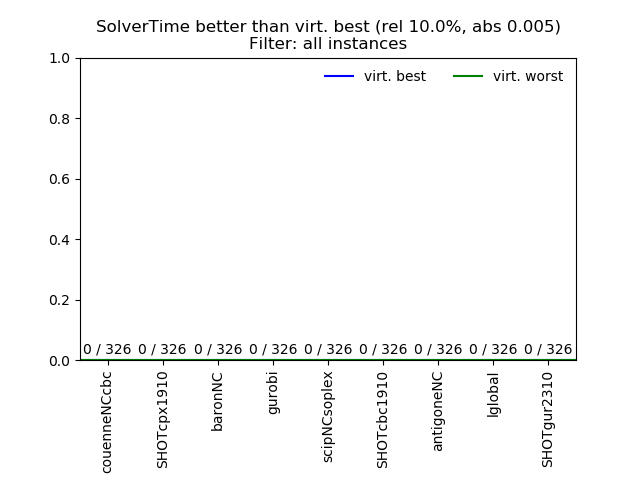
Tolerance:
relative 0.1
absolute 0.005
| Data | couenneNCcbc | SHOTcpx1910 | baronNC | gurobi | scipNCsoplex | SHOTcbc1910 | antigoneNC | lglobal | SHOTgur2310 | virt. worst |
|---|---|---|---|---|---|---|---|---|---|---|
| count | 326.00 | 326.00 | 326.00 | 326.00 | 326.00 | 326.00 | 326.00 | 326.00 | 326.00 | 326.00 |
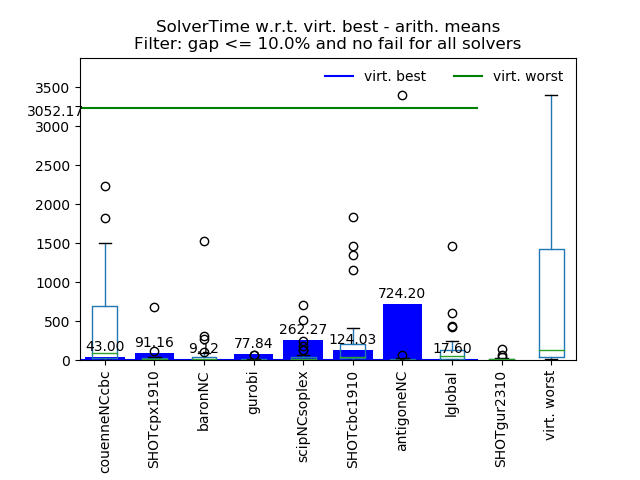
| arith. mean | 3350.80 | 742.50 | 256.27 | 16700.59 | 1653.88 | 206.67 | 776.43 | 4162.68 | 608.85 | 18821.76 |
| arith. std. | 20590.38 | 10115.81 | 981.72 | 50880.30 | 14226.22 | 1014.58 | 2956.58 | 22853.71 | 10080.11 | 52390.74 |
| min | 1.00 | 1.00 | 1.00 | 1.00 | 1.00 | 1.00 | 1.00 | 1.00 | 1.00 | 1.01 |
| 10.0% | 3.23 | 1.00 | 1.47 | 1.00 | 1.88 | 2.46 | 1.00 | 2.73 | 1.00 | 15.97 |
| 25.0% | 26.76 | 1.18 | 5.06 | 1.01 | 7.66 | 8.37 | 1.94 | 16.59 | 1.21 | 77.02 |
| 50.0% | 114.56 | 3.94 | 20.00 | 15.53 | 30.53 | 24.14 | 39.51 | 100.02 | 2.59 | 568.63 |
| 75.0% | 613.91 | 21.48 | 78.08 | 909.09 | 185.43 | 60.49 | 335.04 | 763.51 | 17.34 | 3009.70 |
| 90.0% | 1814.39 | 102.72 | 516.82 | 15142.20 | 1533.81 | 205.73 | 1781.73 | 3093.37 | 58.53 | 31416.67 |
| max | 182000.00 | 182000.00 | 10024.37 | 182000.00 | 180000.40 | 14812.07 | 39565.22 | 182000.00 | 182000.00 | 182000.00 |
| better | 0.00 | 0.00 | 0.00 | 0.00 | 0.00 | 0.00 | 0.00 | 0.00 | 0.00 | 0.00 |
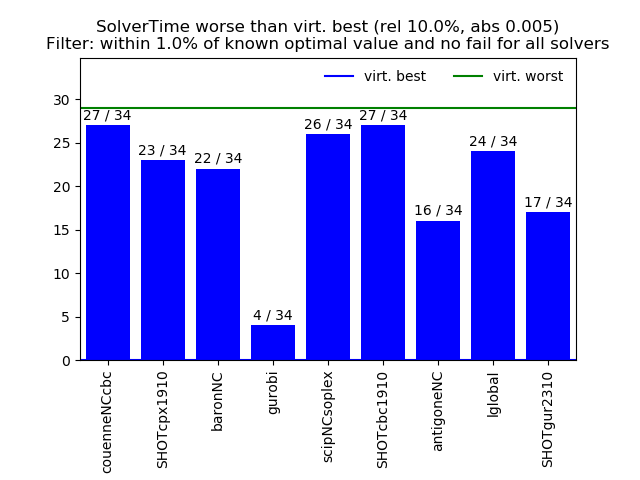
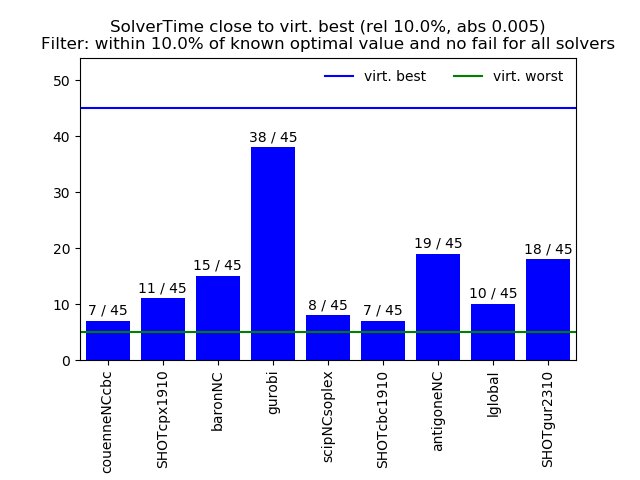
| close | 31.00 | 108.00 | 59.00 | 112.00 | 37.00 | 36.00 | 66.00 | 29.00 | 123.00 | 7.00 |
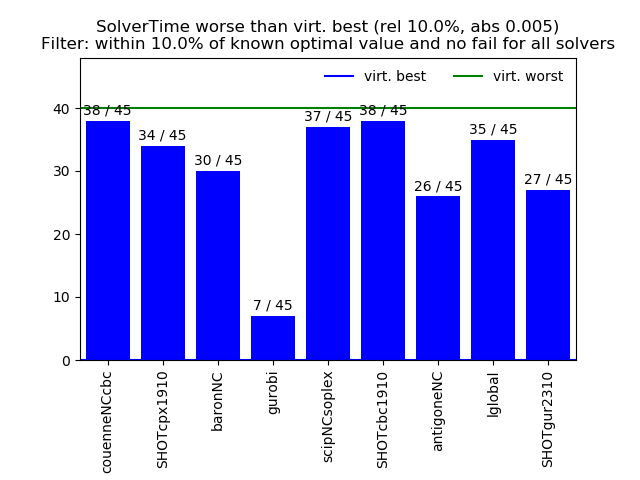
| worse | 295.00 | 218.00 | 267.00 | 214.00 | 289.00 | 290.00 | 260.00 | 297.00 | 203.00 | 319.00 |