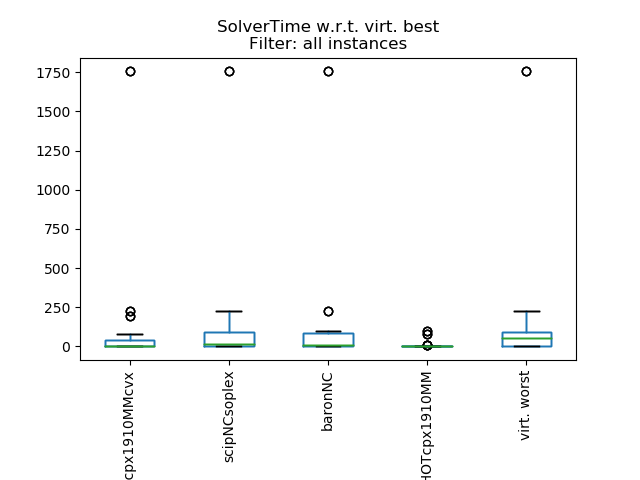
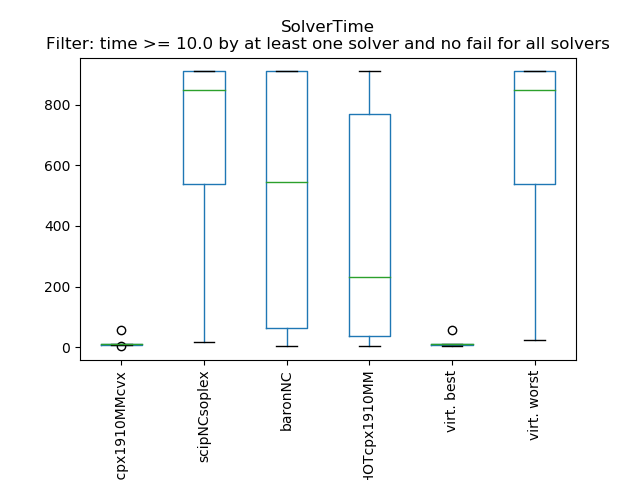
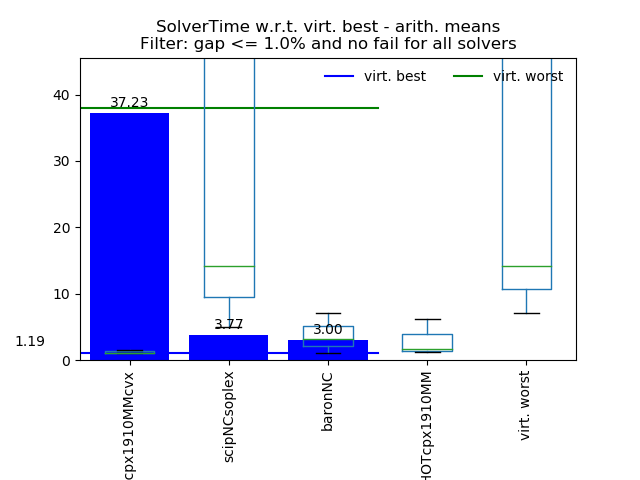
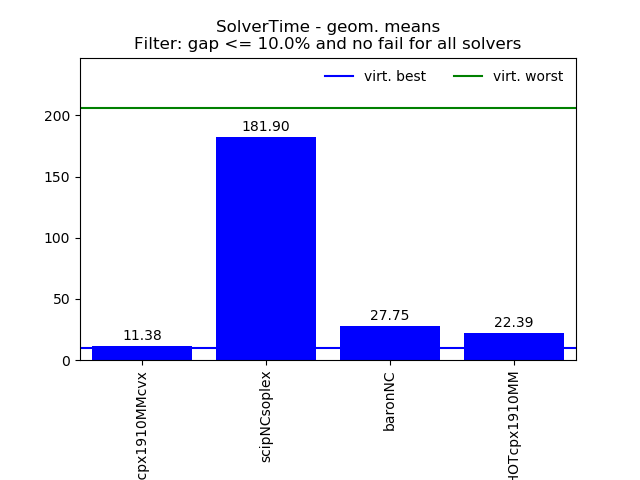
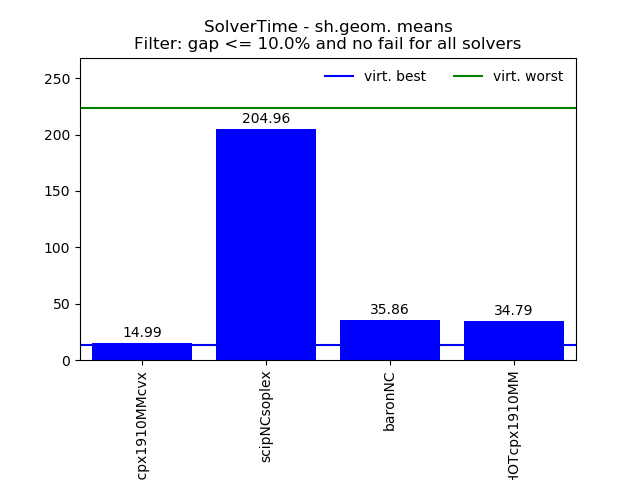
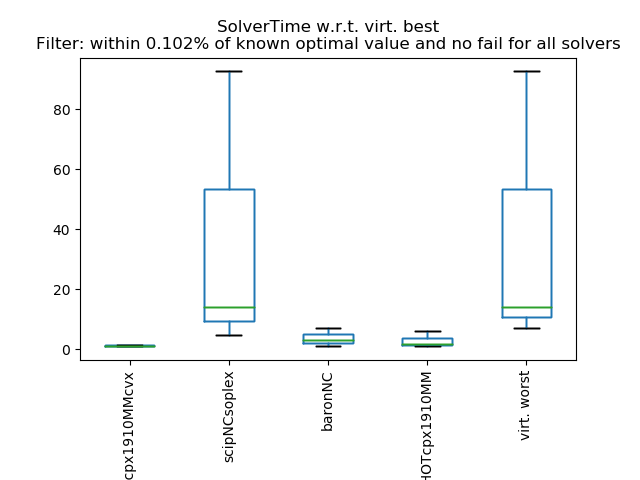
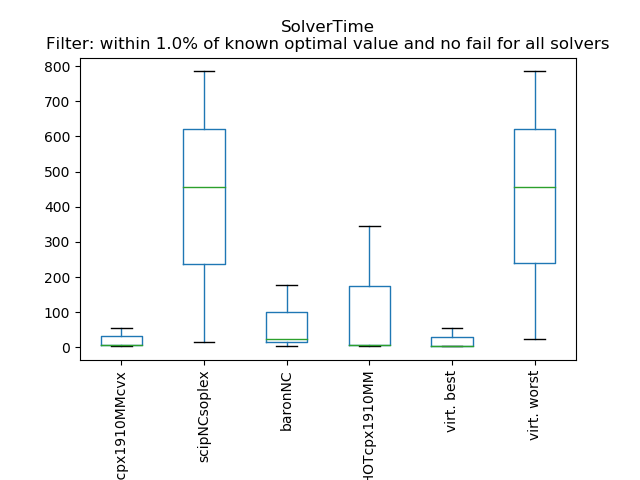
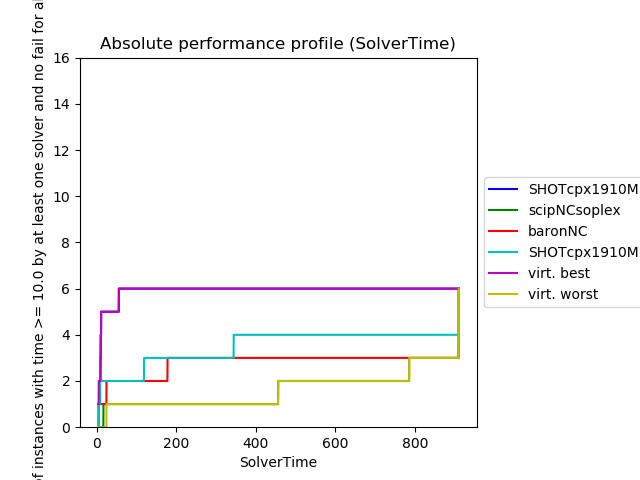
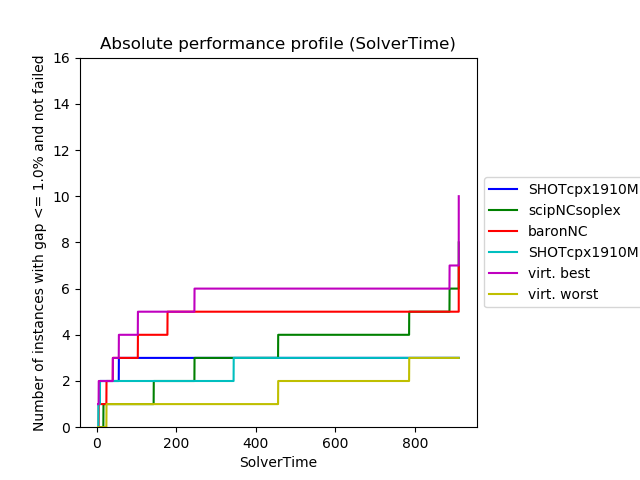
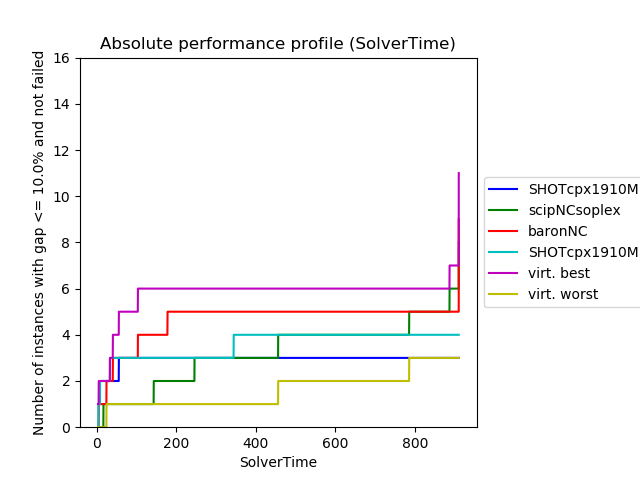
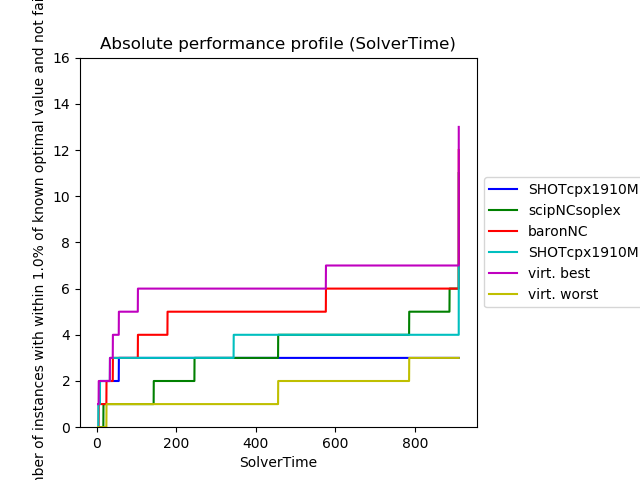
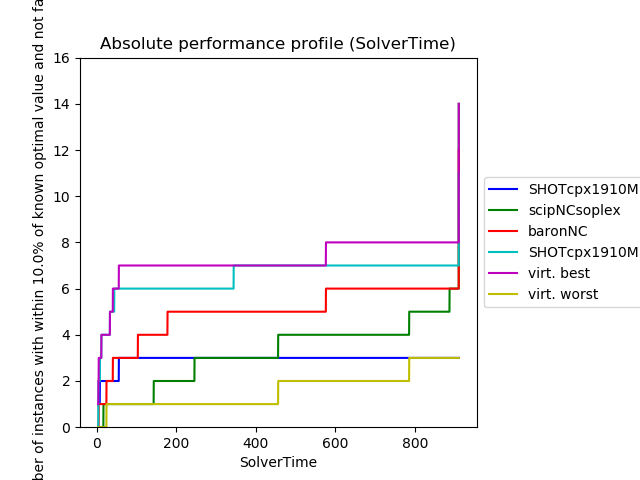
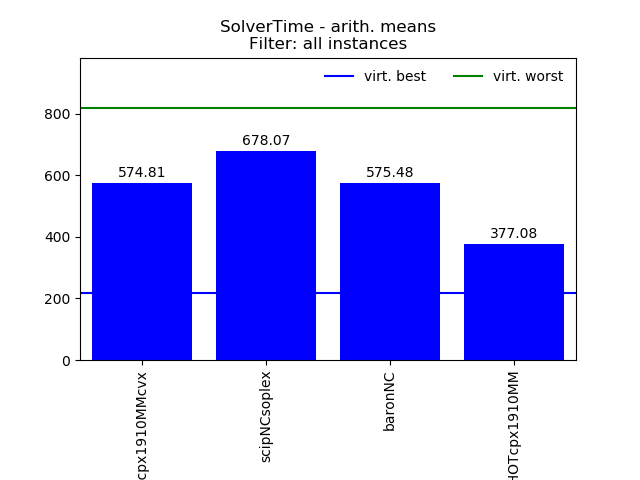
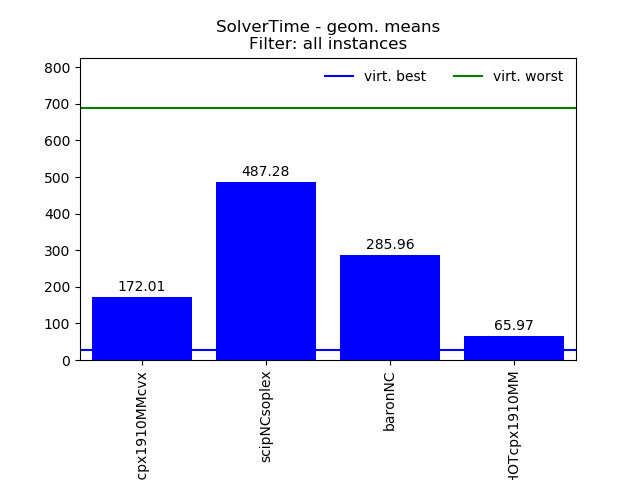
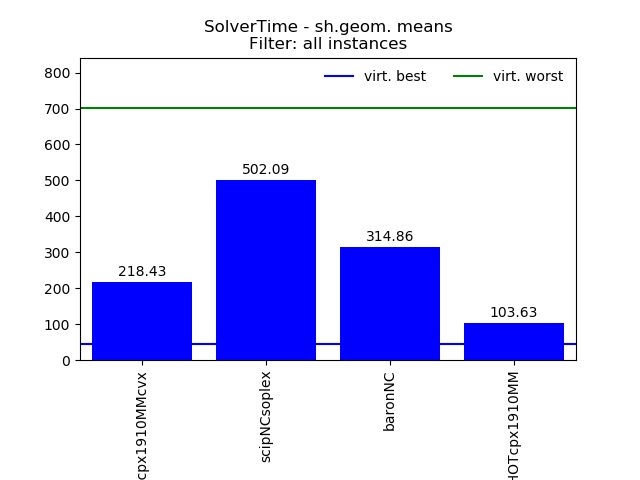
SolverTime
Filter: all instances
Attribute values were projected onto interval [0.005, 910.0].
Missing values and values for failed instances substituted by 910.0 .
| Data | SHOTcpx1910MMcvx | scipNCsoplex | baronNC | SHOTcpx1910MM | virt. best | virt. worst |
|---|---|---|---|---|---|---|
| count | 16.00 | 16.00 | 16.00 | 16.00 | 16.00 | 16.00 |
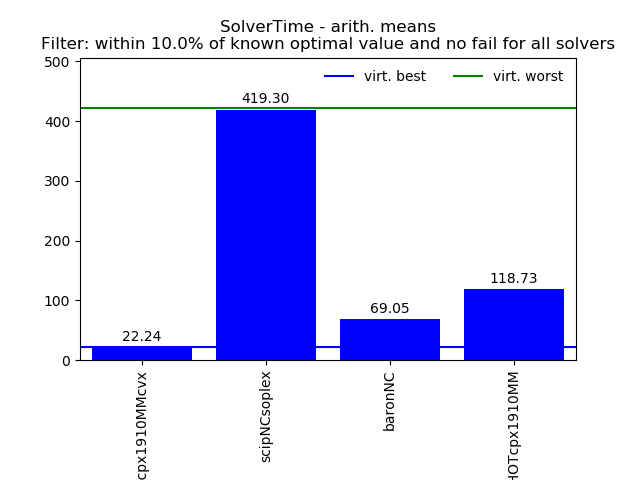
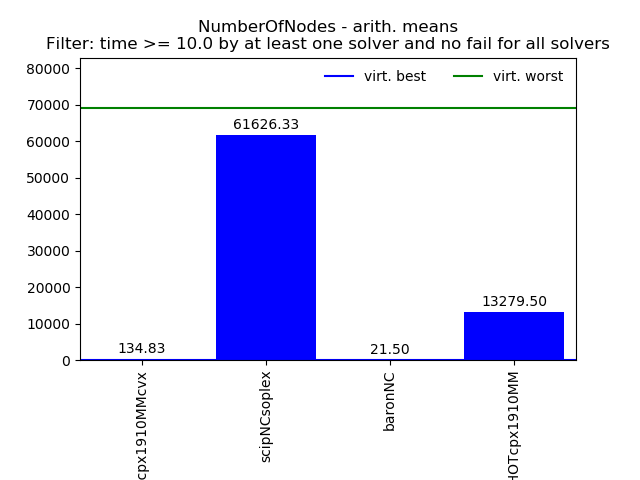
| arith. mean | 574.81 | 678.07 | 575.48 | 377.08 | 218.43 | 818.47 |
| arith. std. | 447.06 | 346.78 | 411.39 | 434.32 | 370.50 | 241.11 |
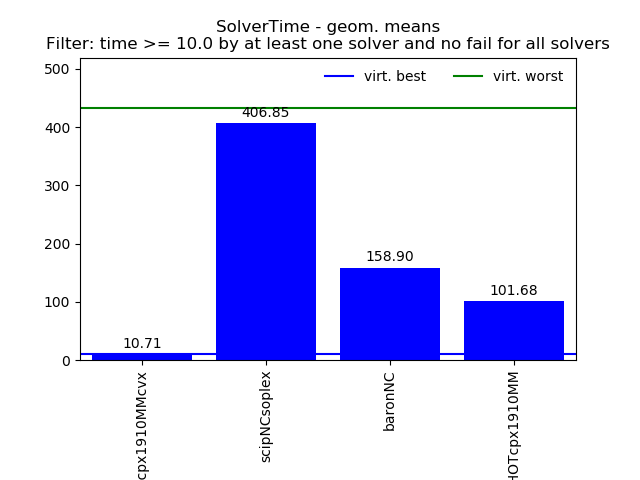
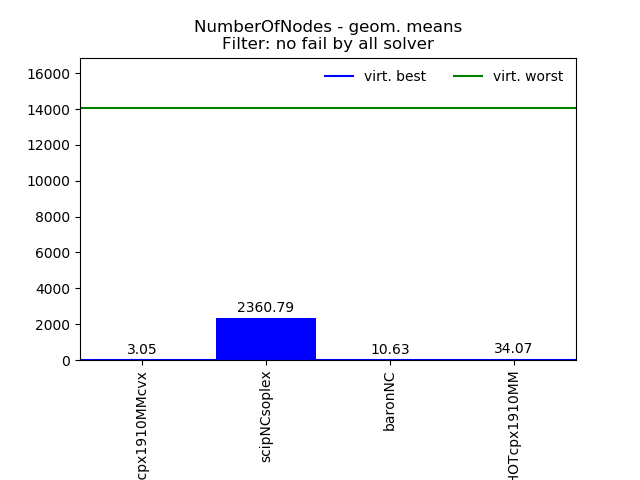
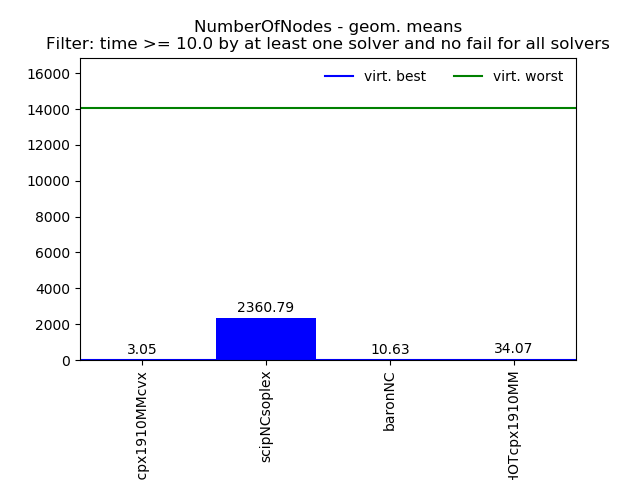
| geom. mean | 172.01 | 487.28 | 285.96 | 65.97 | 26.66 | 688.76 |
| geom. std. | 9.12 | 2.99 | 5.01 | 11.95 | 9.39 | 2.41 |
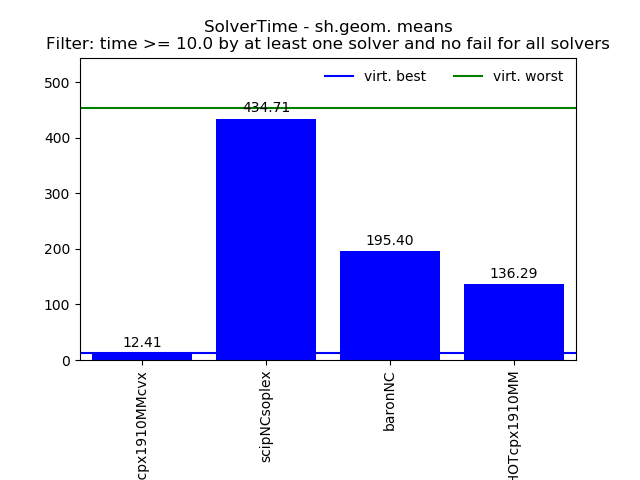
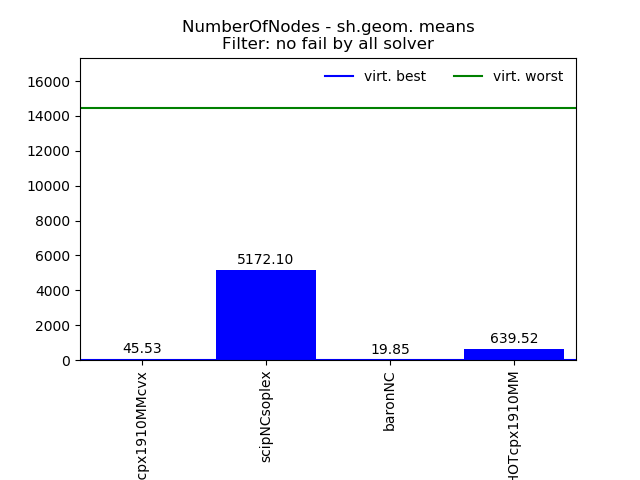
| sh.geom. mean | 218.43 | 502.09 | 314.86 | 103.63 | 43.85 | 701.50 |
| sh.geom. std. | 6.20 | 2.72 | 4.01 | 6.25 | 5.19 | 2.22 |
| min | 3.43 | 16.81 | 4.92 | 0.52 | 0.52 | 24.42 |
| 10.0% | 8.55 | 134.50 | 32.45 | 4.06 | 3.75 | 620.54 |
| 25.0% | 10.76 | 403.31 | 100.20 | 7.23 | 4.87 | 910.00 |
| 50.0% | 910.00 | 910.00 | 910.00 | 81.43 | 11.36 | 910.00 |
| 75.0% | 910.00 | 910.00 | 910.00 | 910.00 | 185.66 | 910.00 |
| 90.0% | 910.00 | 910.00 | 910.00 | 910.00 | 910.00 | 910.00 |
| max | 910.00 | 910.00 | 910.00 | 910.00 | 910.00 | 910.00 |

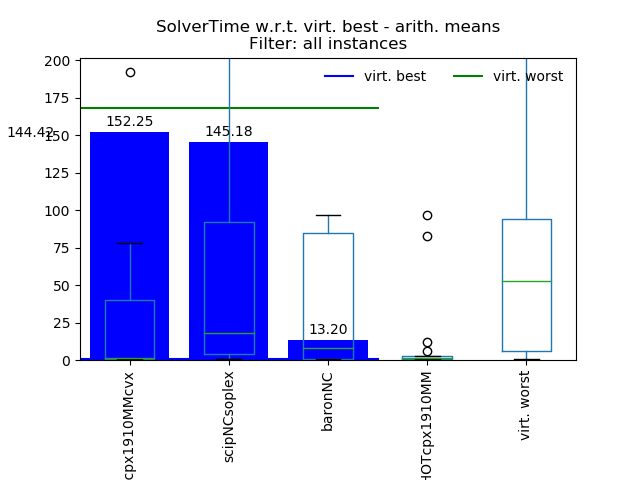
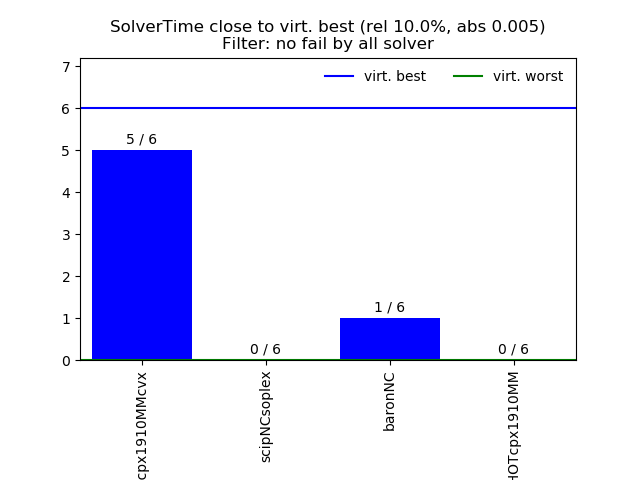
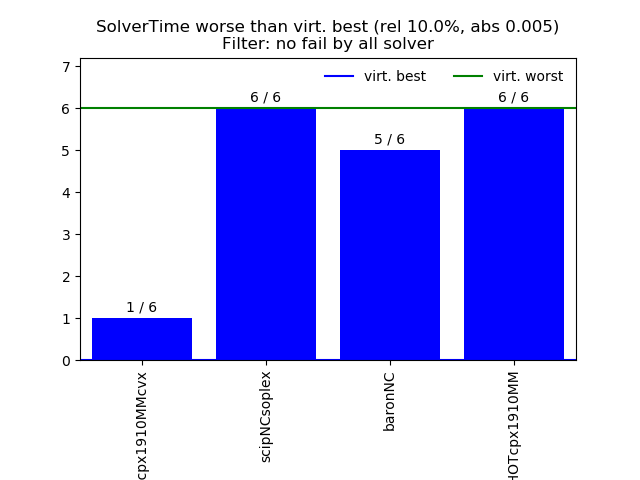
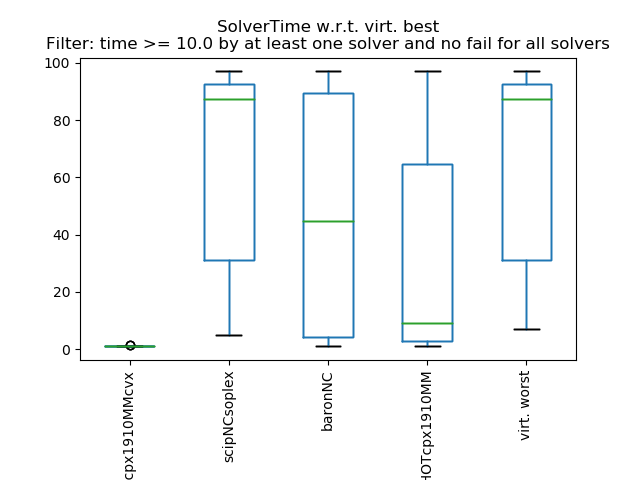
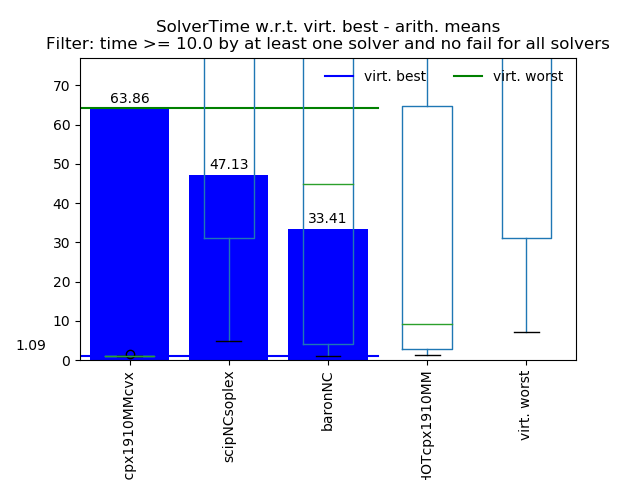
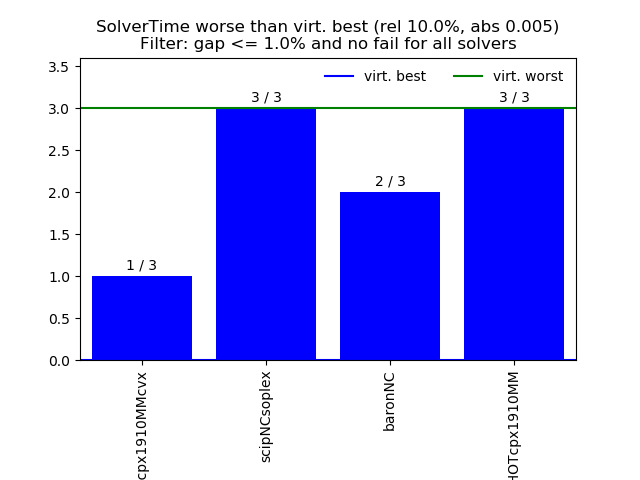
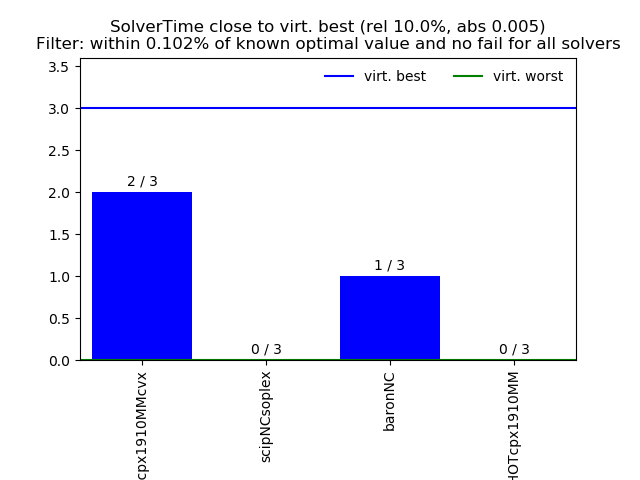
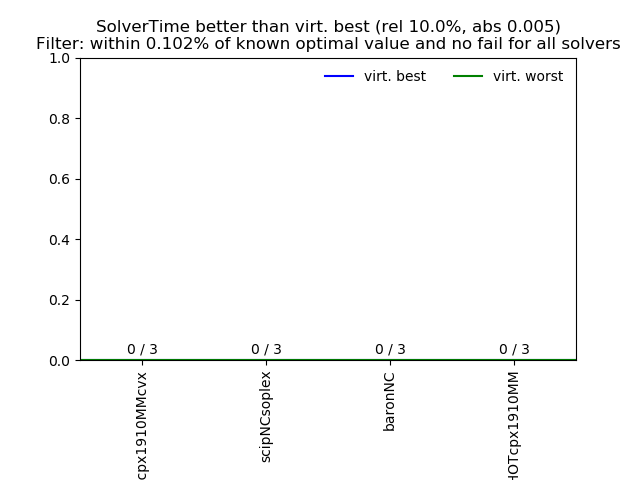
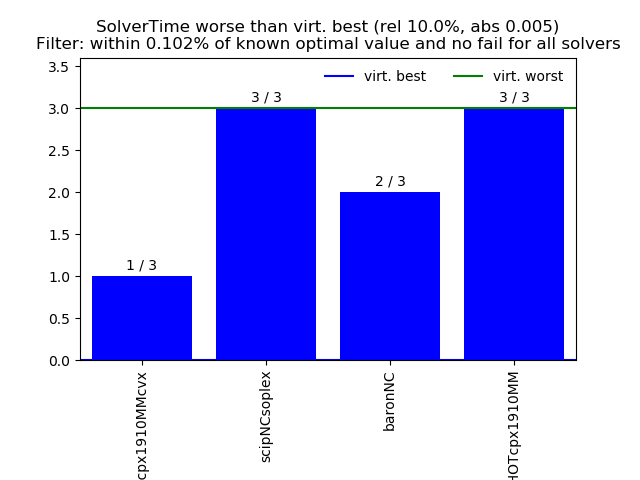
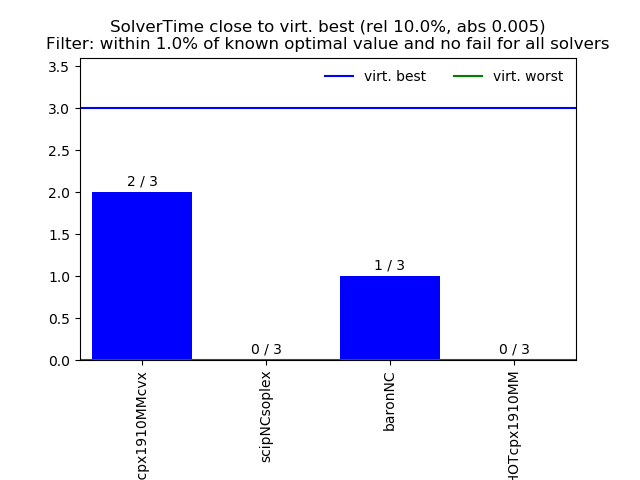
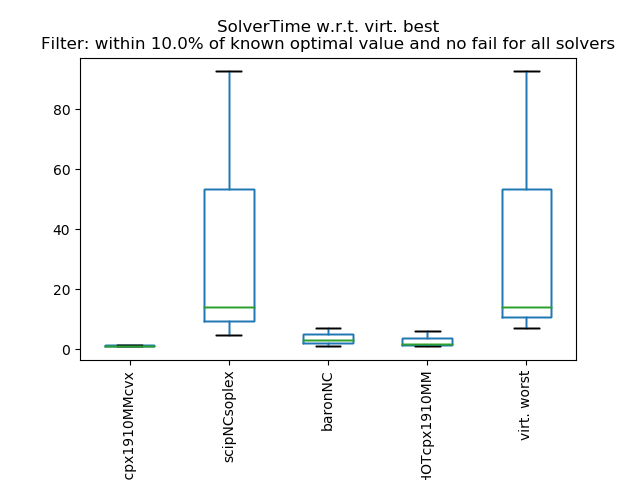
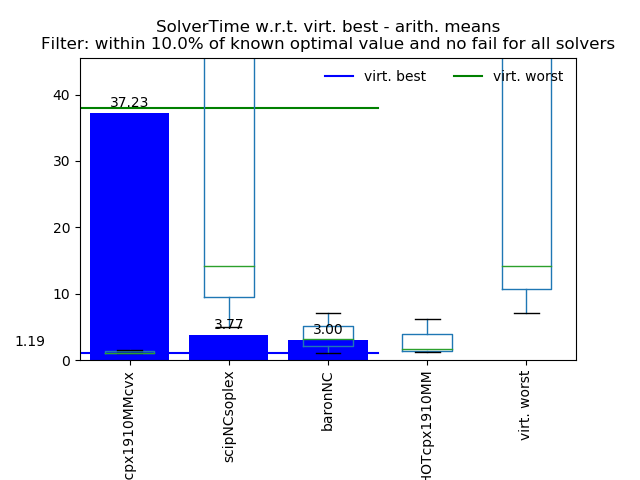
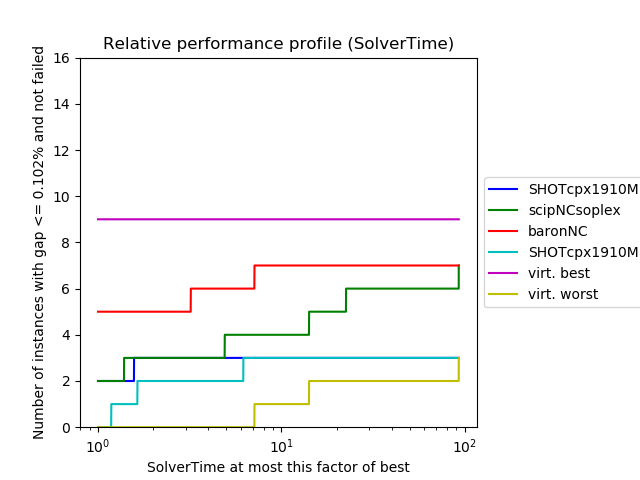
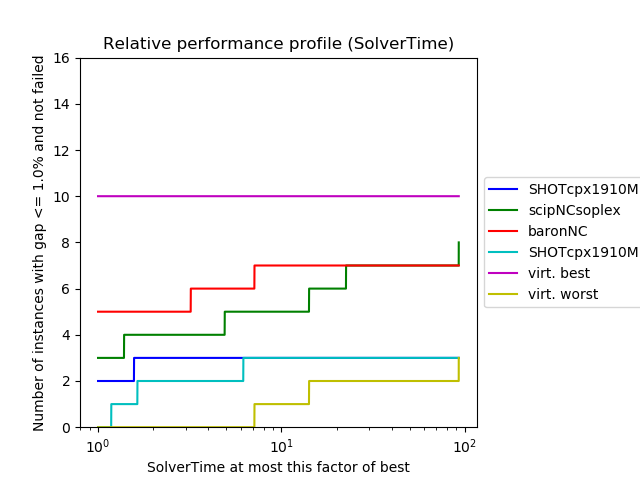
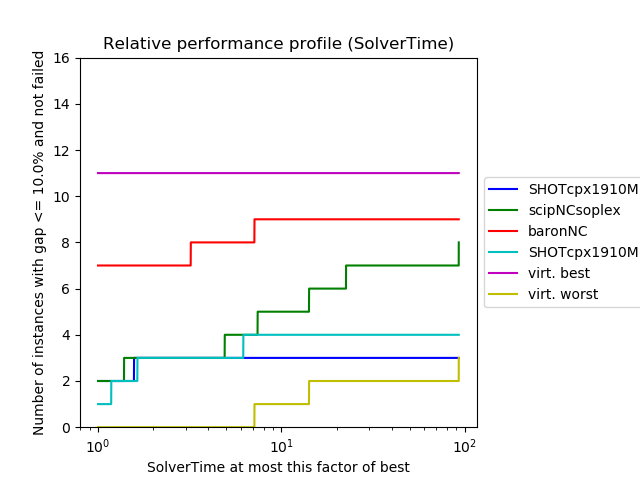
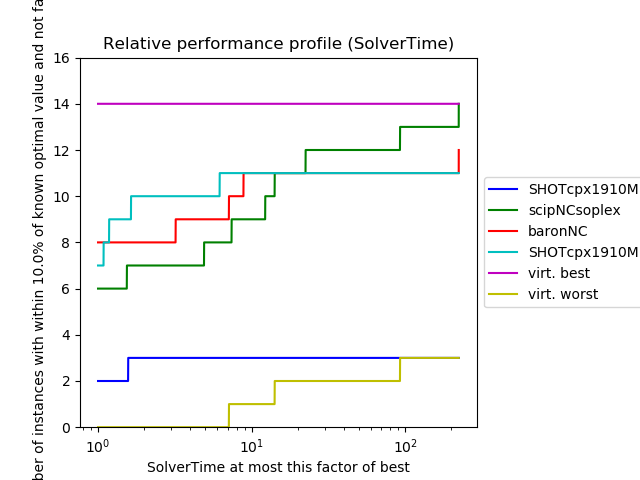
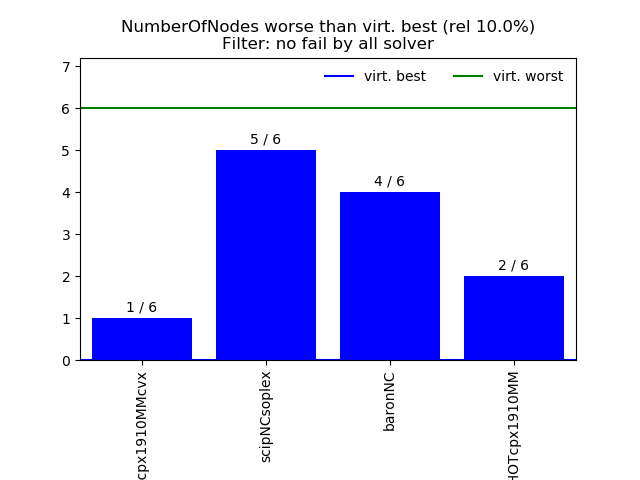
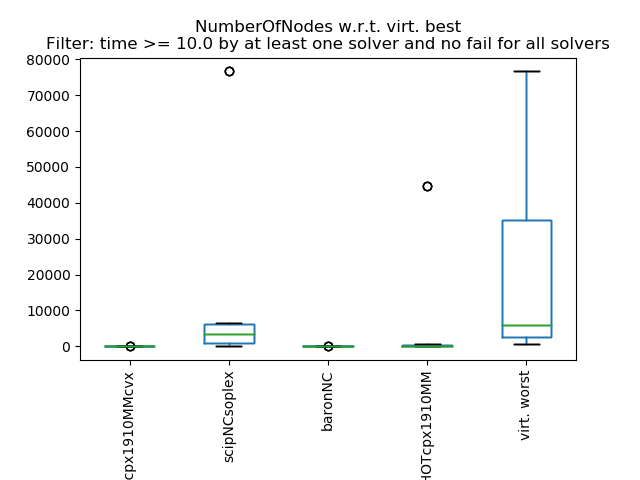
Performance with respect to virt. best:
Tolerance:
relative 0.1
absolute 0.005
| Data | SHOTcpx1910MMcvx | scipNCsoplex | baronNC | SHOTcpx1910MM | virt. worst |
|---|---|---|---|---|---|
| count | 16.00 | 16.00 | 16.00 | 16.00 | 16.00 |
| arith. mean | 144.42 | 152.25 | 145.18 | 13.20 | 168.09 |
| arith. std. | 435.38 | 431.80 | 433.70 | 30.13 | 428.83 |
| min | 1.00 | 1.00 | 1.00 | 1.00 | 1.00 |
| 10.0% | 1.00 | 1.00 | 1.00 | 1.00 | 1.00 |
| 25.0% | 1.00 | 4.06 | 1.00 | 1.00 | 5.73 |
| 50.0% | 1.28 | 18.31 | 7.99 | 1.04 | 52.70 |
| 75.0% | 40.08 | 92.20 | 84.80 | 2.78 | 93.75 |
| 90.0% | 207.95 | 160.44 | 160.44 | 47.21 | 207.95 |
| max | 1755.75 | 1755.75 | 1755.75 | 97.04 | 1755.75 |
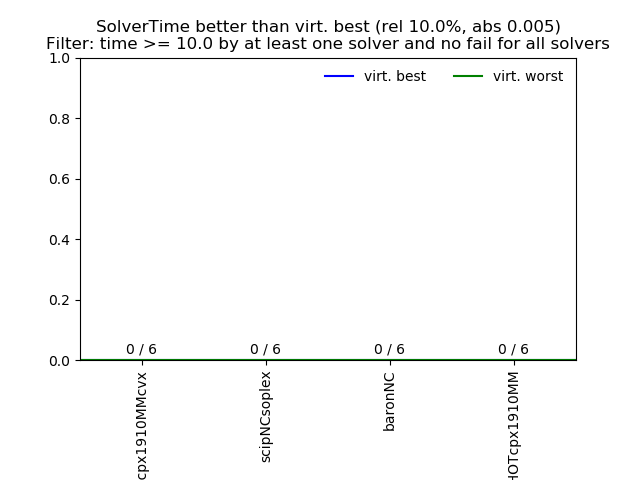
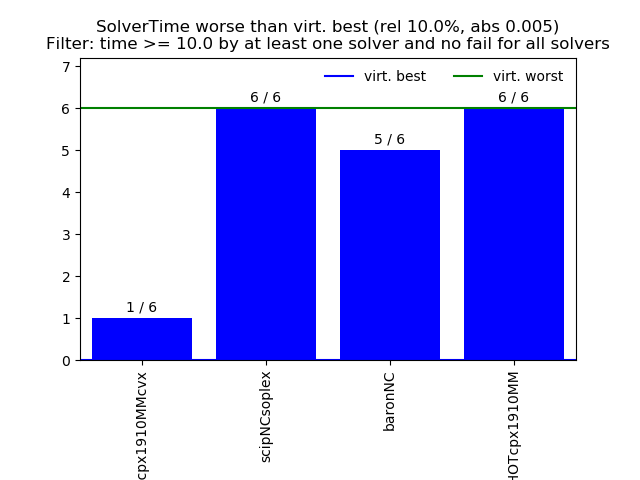
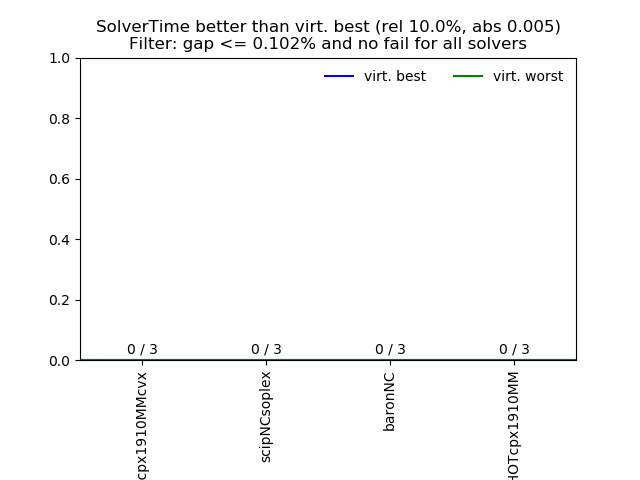
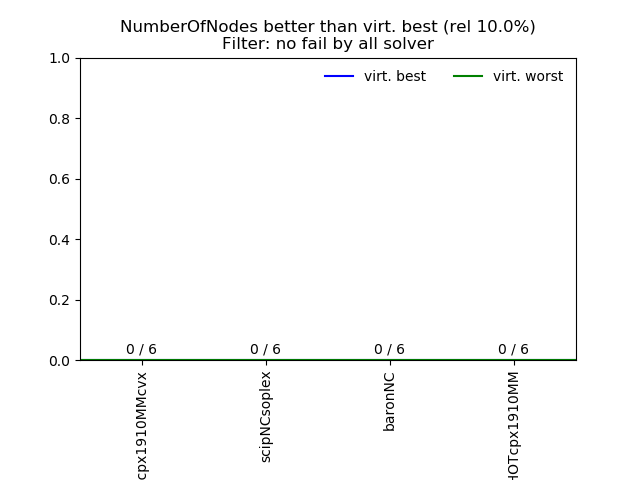
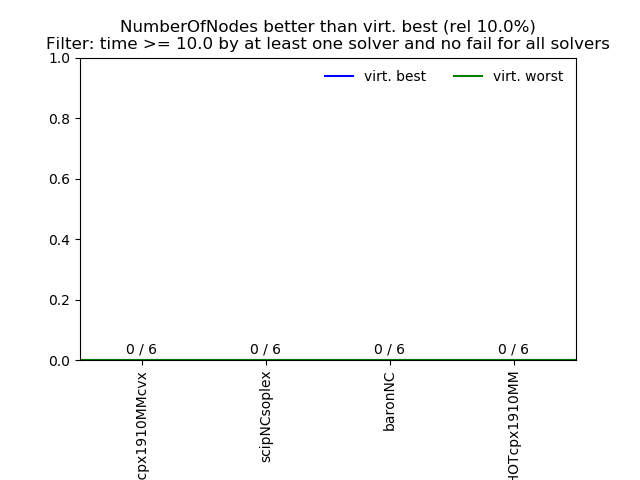
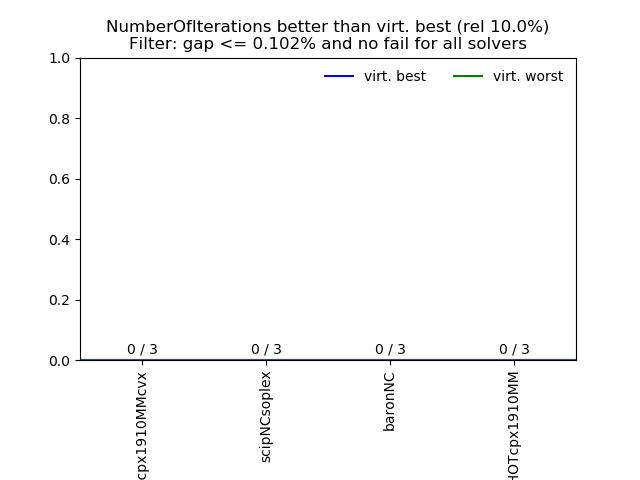
| better | 0.00 | 0.00 | 0.00 | 0.00 | 0.00 |
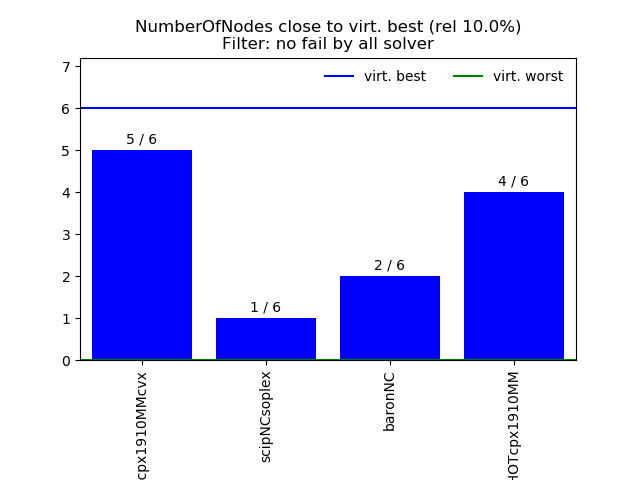
| close | 8.00 | 3.00 | 6.00 | 9.00 | 3.00 |
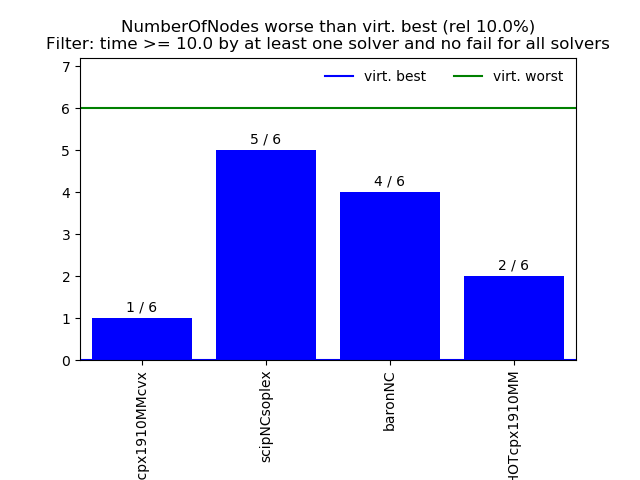
| worse | 8.00 | 13.00 | 10.00 | 7.00 | 13.00 |