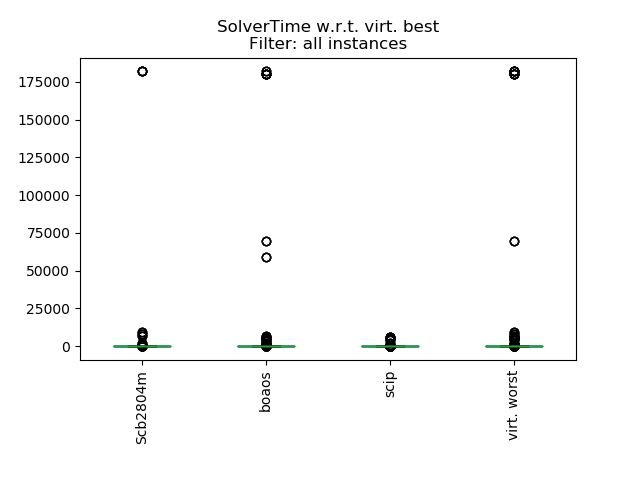
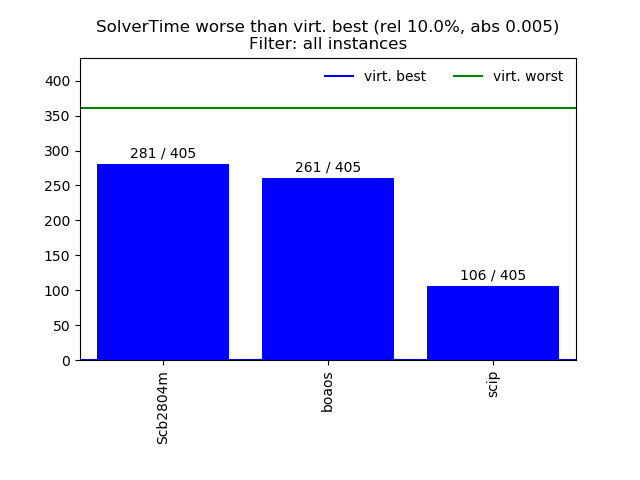
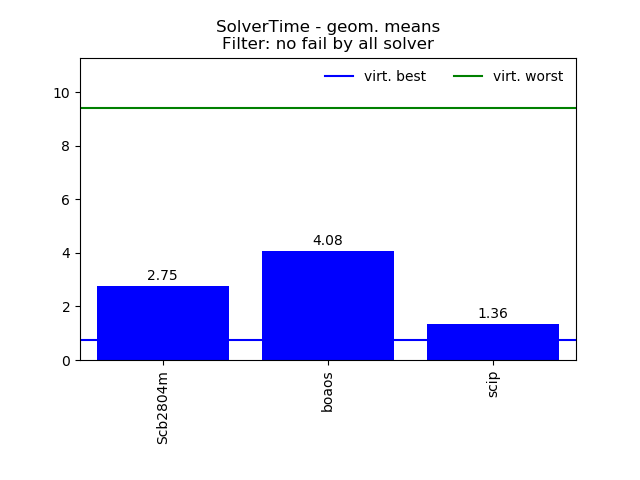
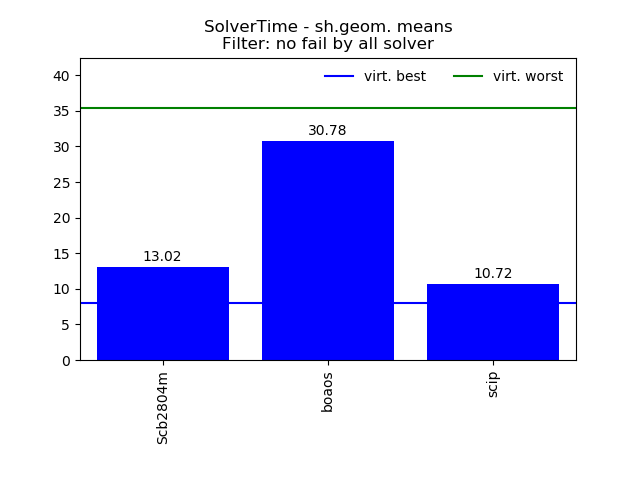
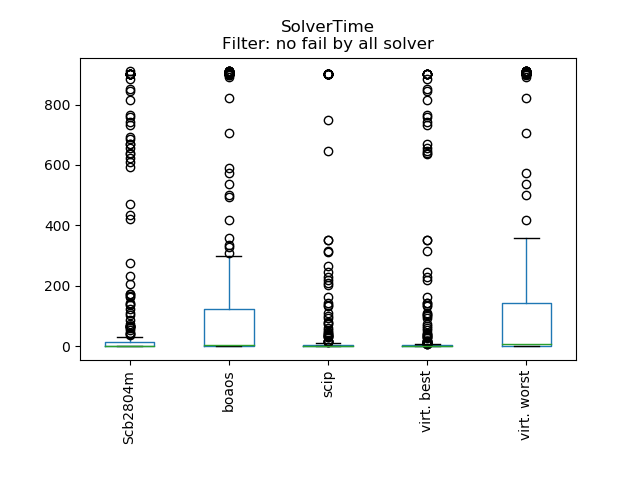
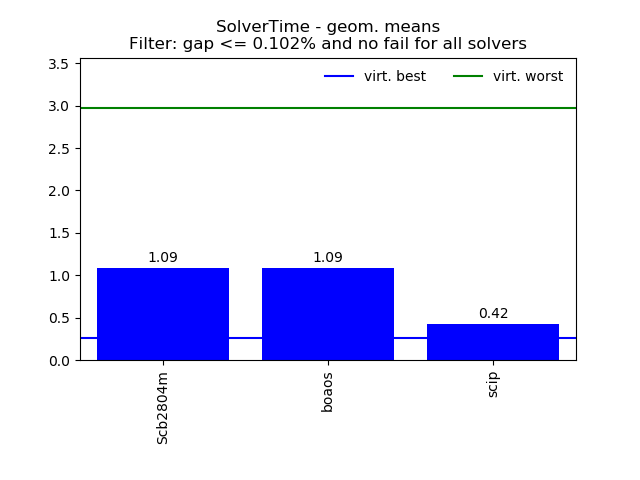
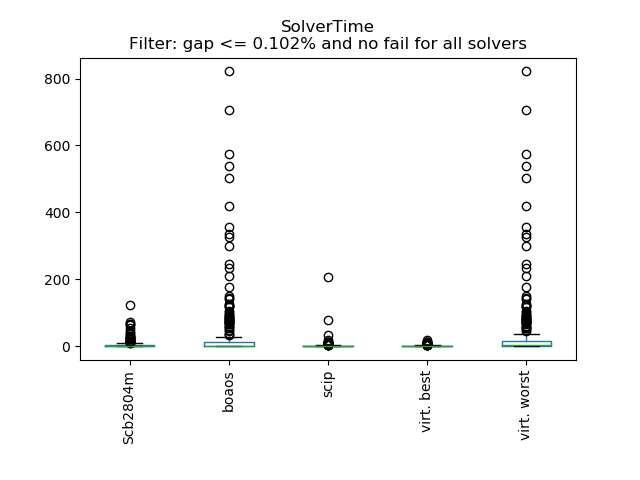
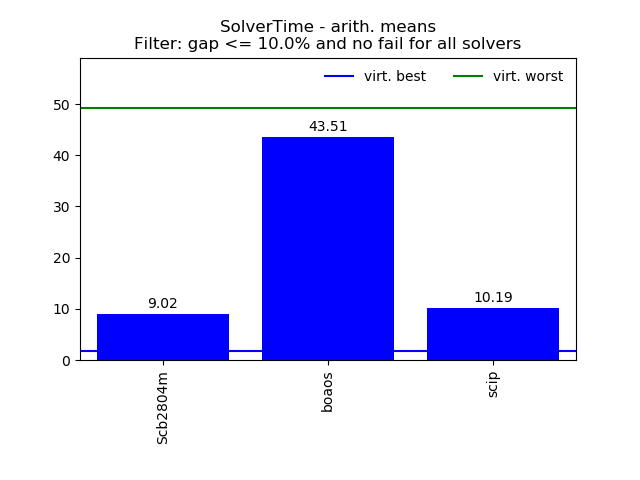
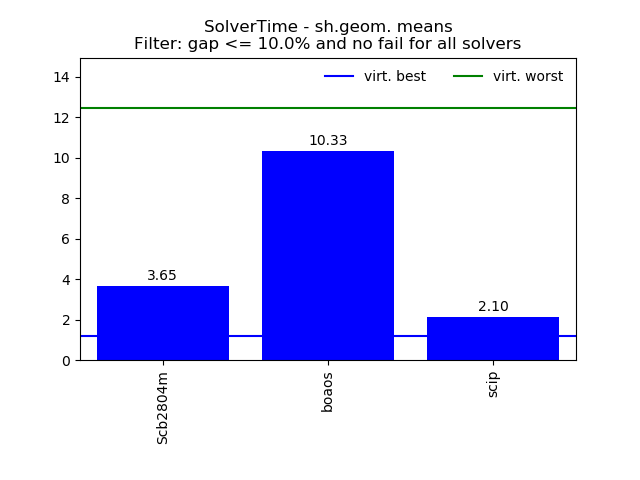
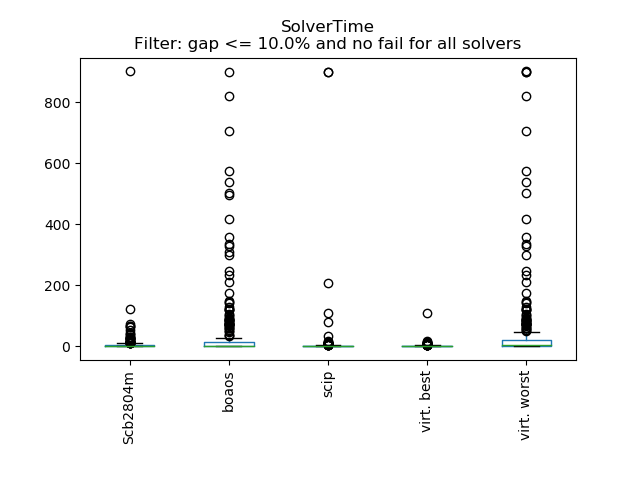
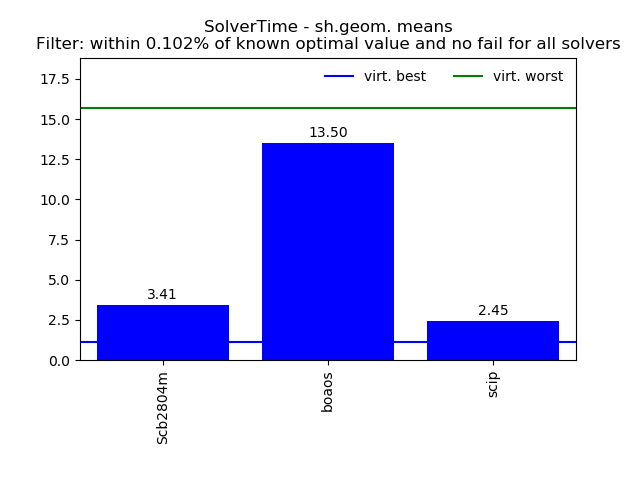
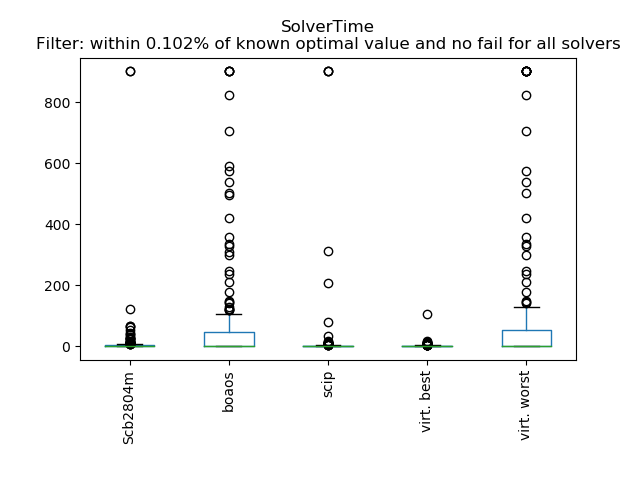
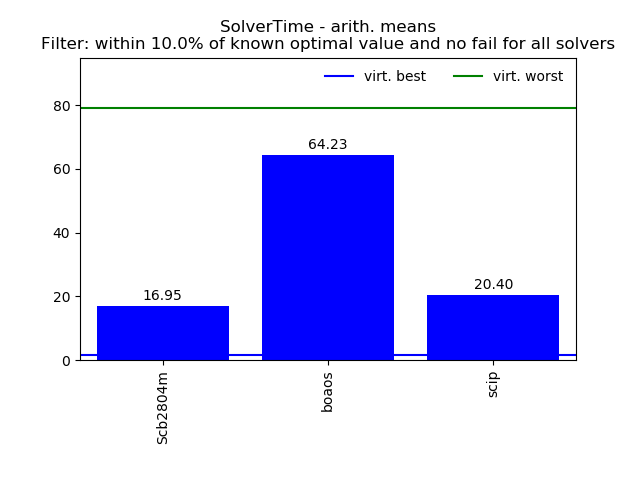
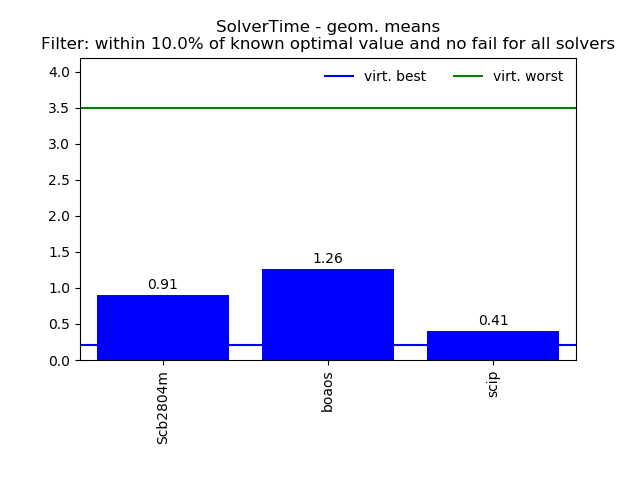
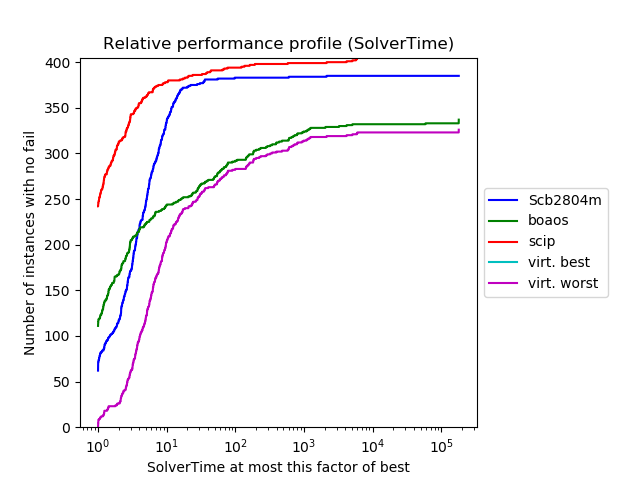
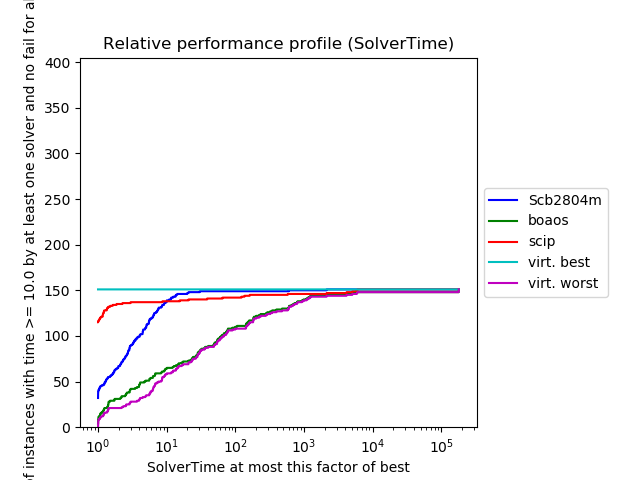
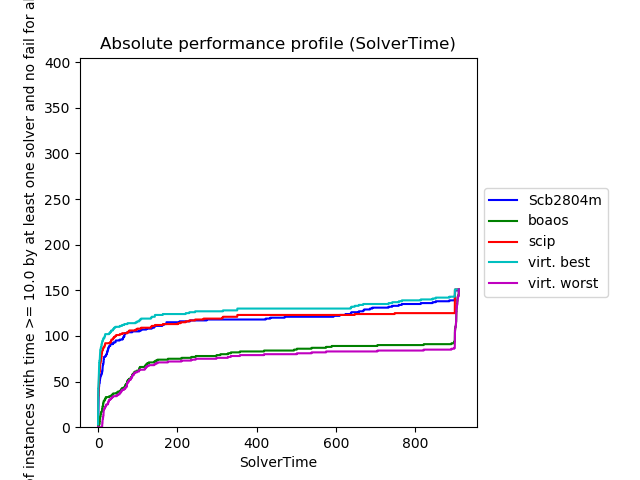
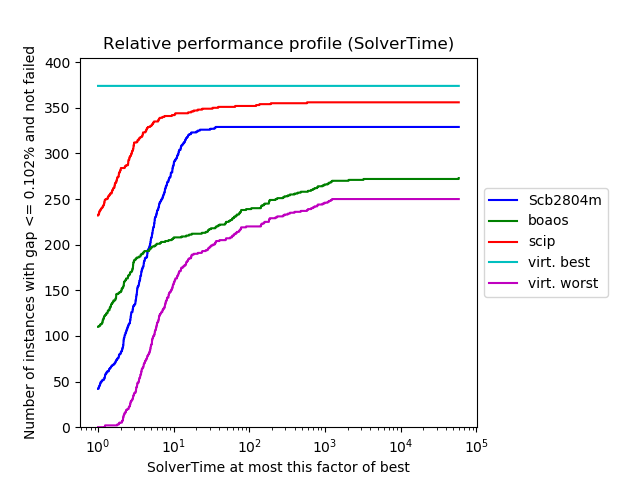
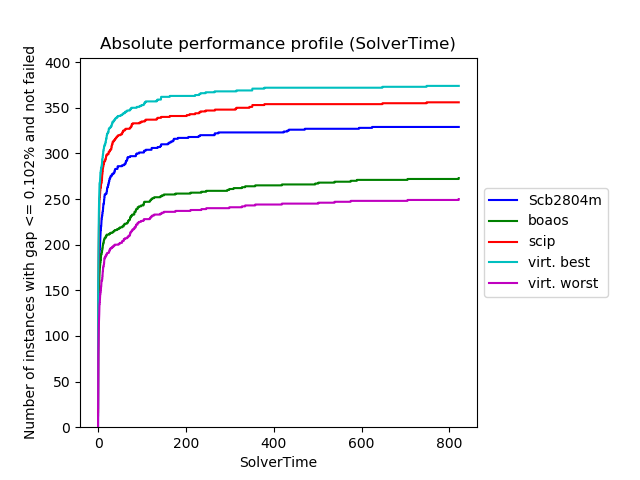
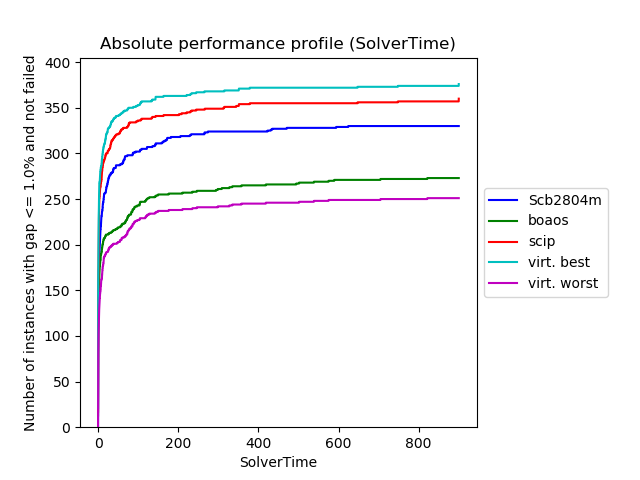
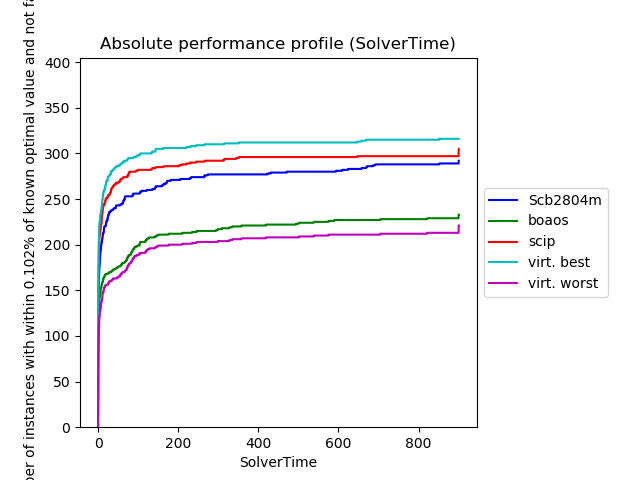
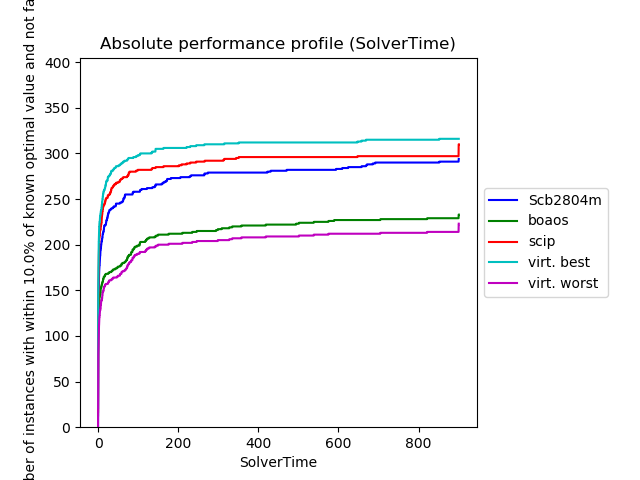
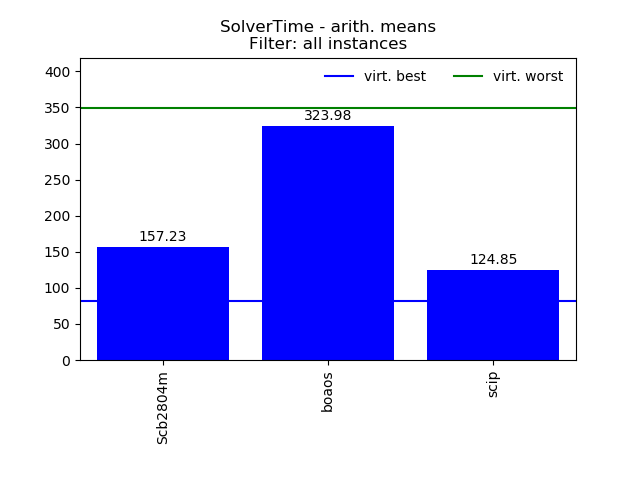
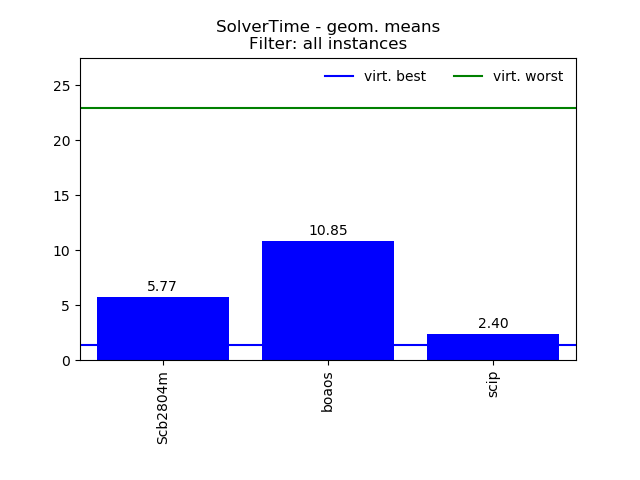
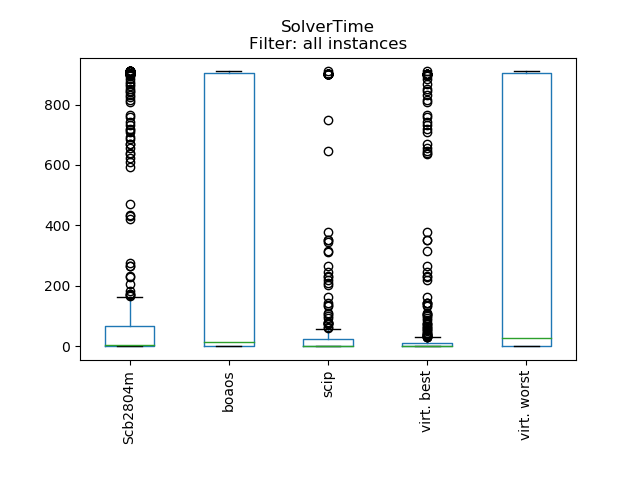
SolverTime
Filter: all instances
Attribute values were projected onto interval [0.005, 910.0].
Missing values and values for failed instances substituted by 910.0 .
| Data | Scb2804m | boaos | scip | virt. best | virt. worst |
|---|---|---|---|---|---|
| count | 405.00 | 405.00 | 405.00 | 405.00 | 405.00 |
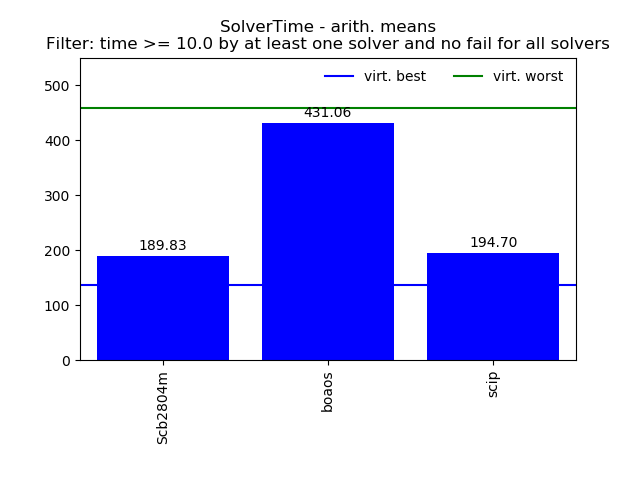
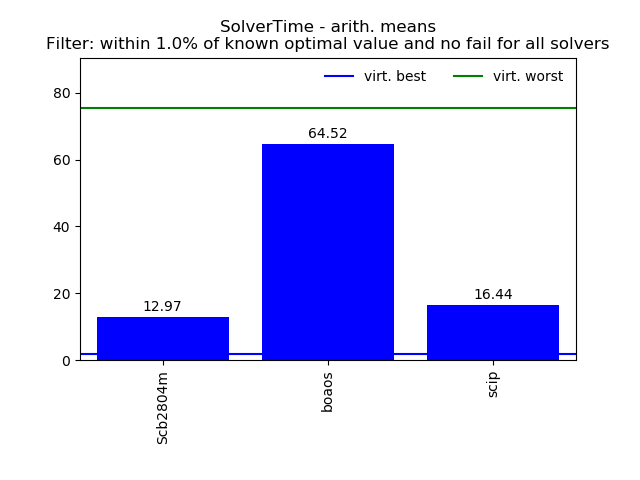
| arith. mean | 157.23 | 323.98 | 124.85 | 81.93 | 349.24 |
| arith. std. | 309.20 | 416.29 | 290.29 | 227.11 | 425.26 |
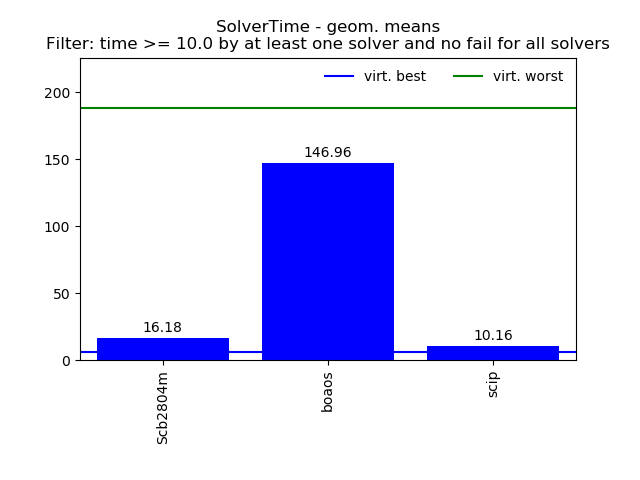
| geom. mean | 5.77 | 10.85 | 2.40 | 1.34 | 22.95 |
| geom. std. | 22.22 | 59.35 | 27.89 | 27.02 | 30.16 |
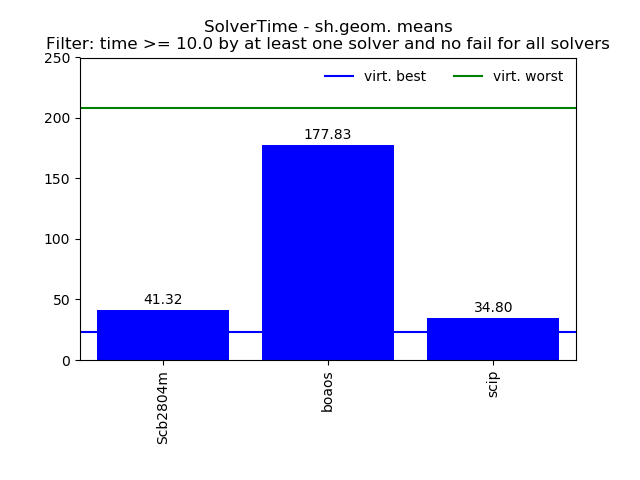
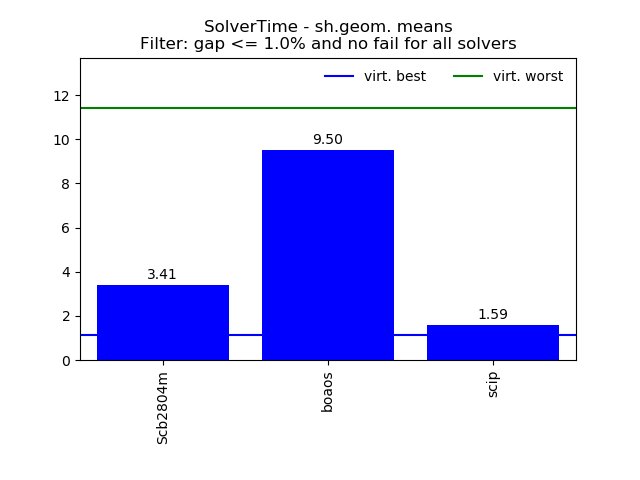
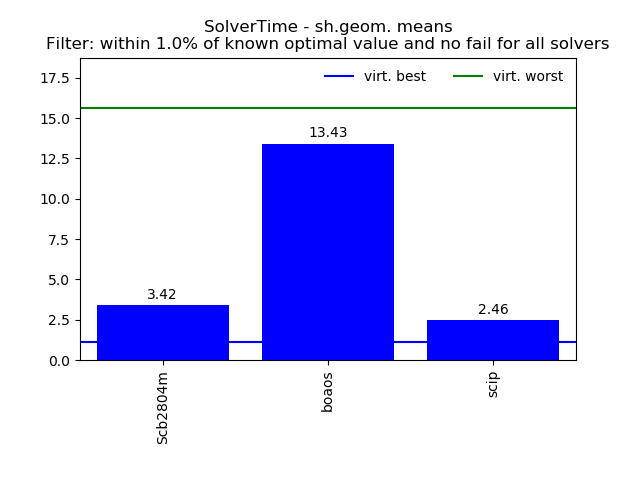
| sh.geom. mean | 24.50 | 60.82 | 16.28 | 11.43 | 71.65 |
| sh.geom. std. | 5.10 | 7.37 | 4.58 | 3.73 | 7.29 |
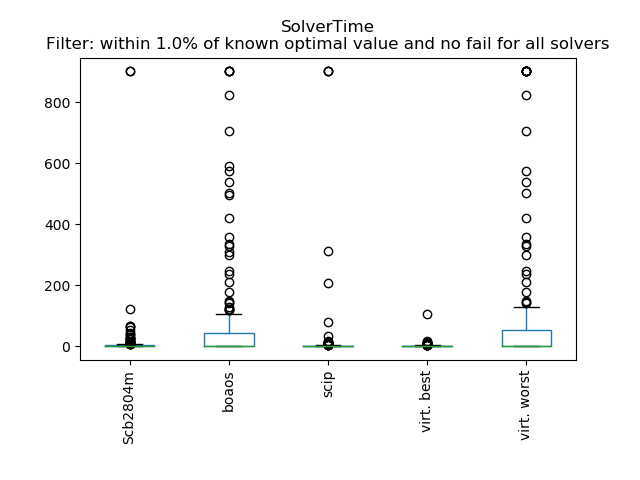
| min | 0.04 | 0.01 | 0.01 | 0.01 | 0.04 |
| 10.0% | 0.14 | 0.03 | 0.05 | 0.02 | 0.17 |
| 25.0% | 0.33 | 0.32 | 0.19 | 0.11 | 1.14 |
| 50.0% | 4.30 | 12.58 | 1.57 | 1.17 | 25.96 |
| 75.0% | 65.95 | 903.58 | 24.30 | 12.40 | 904.26 |
| 90.0% | 865.18 | 910.00 | 900.00 | 226.37 | 910.00 |
| max | 910.00 | 910.00 | 910.00 | 910.00 | 910.00 |

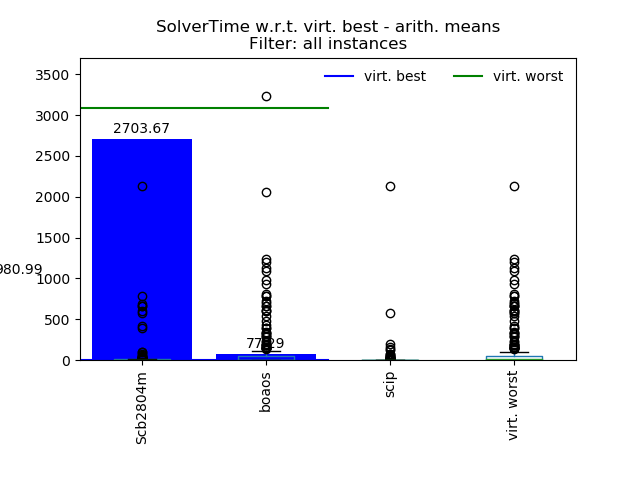
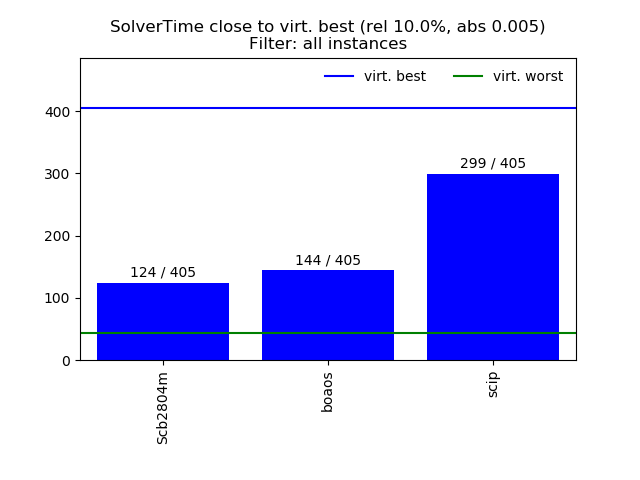
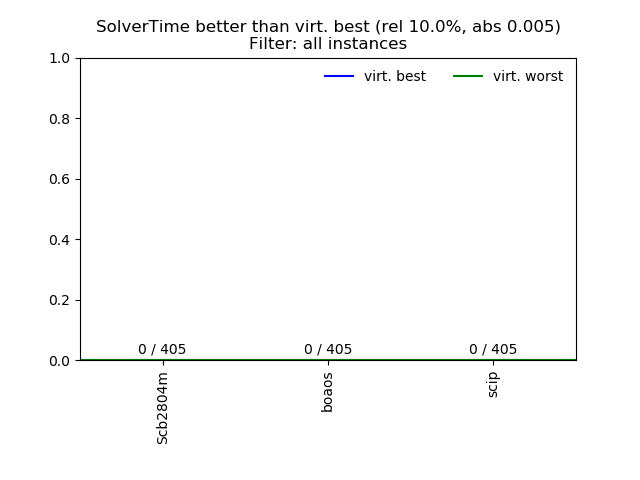
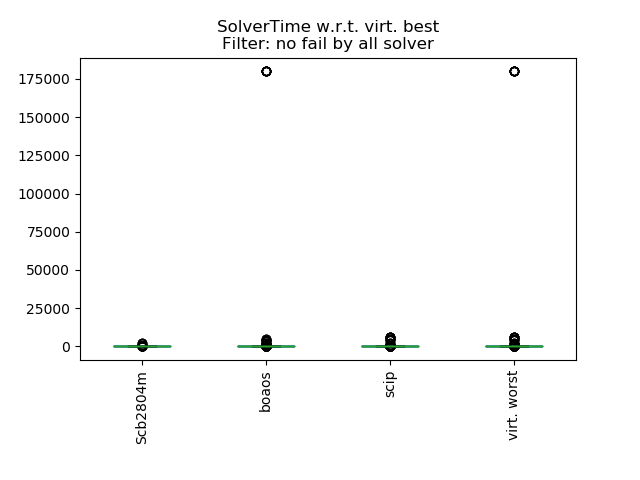
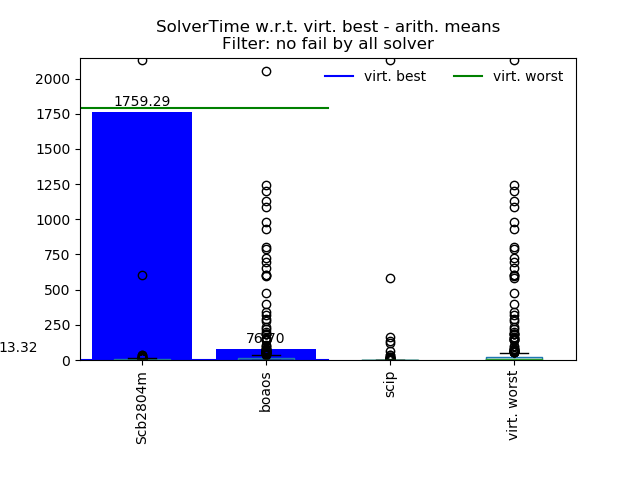
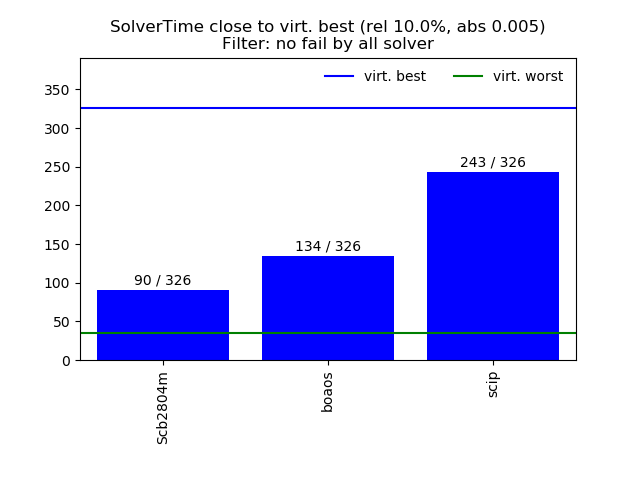
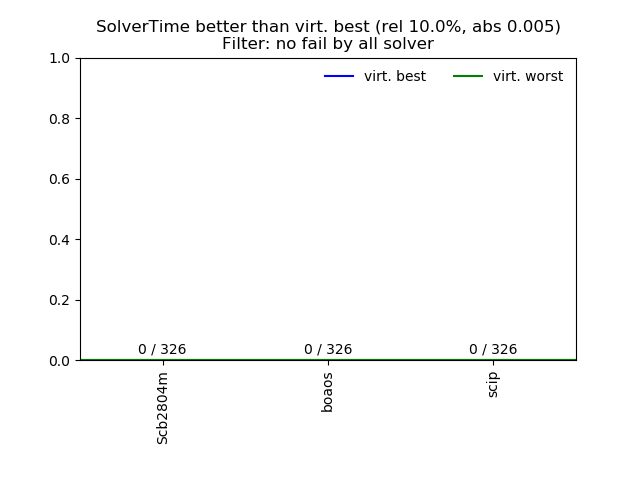
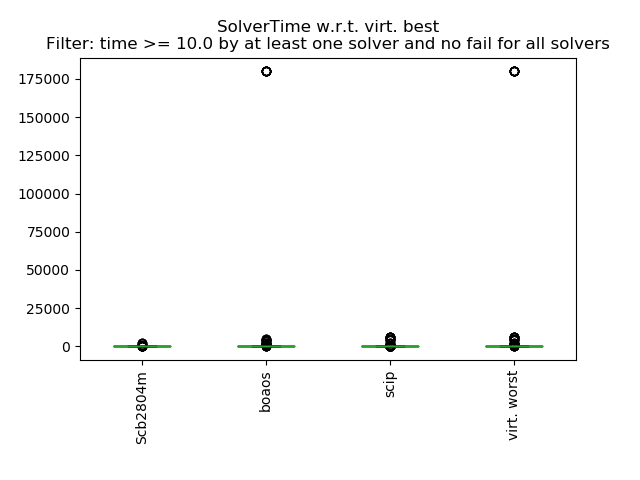
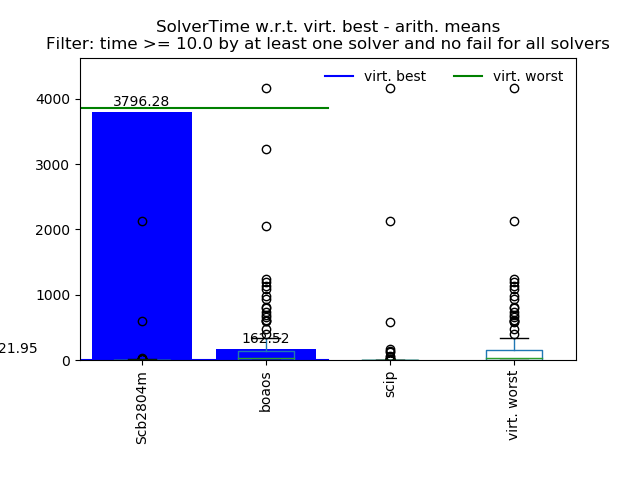
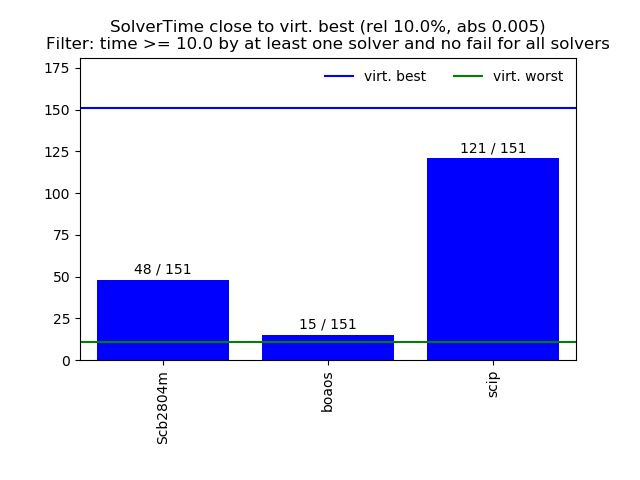
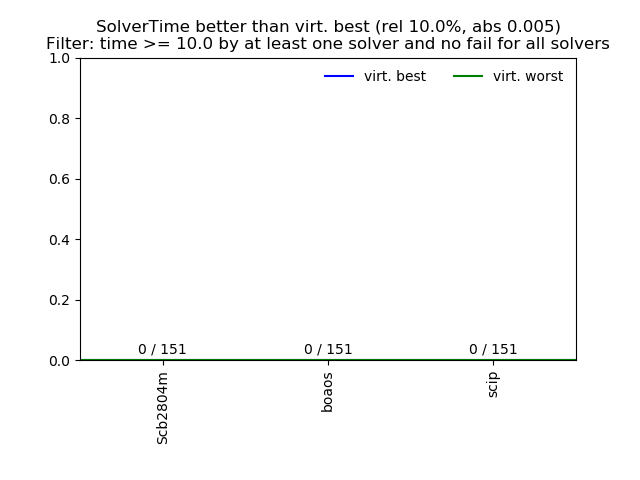
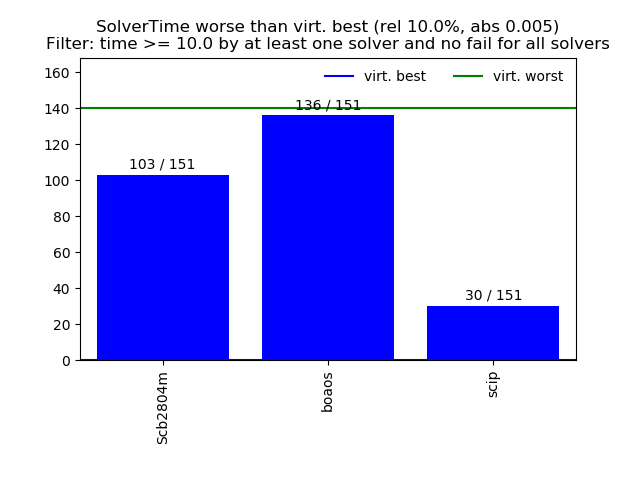
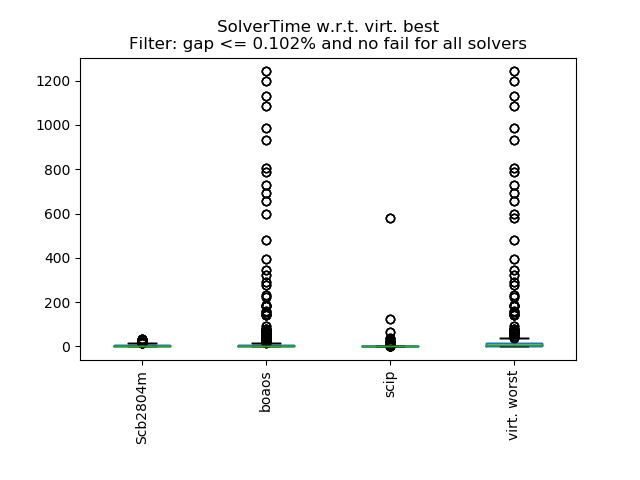
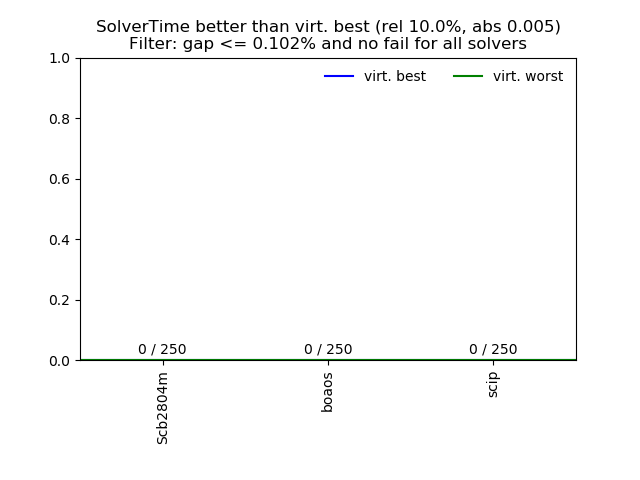
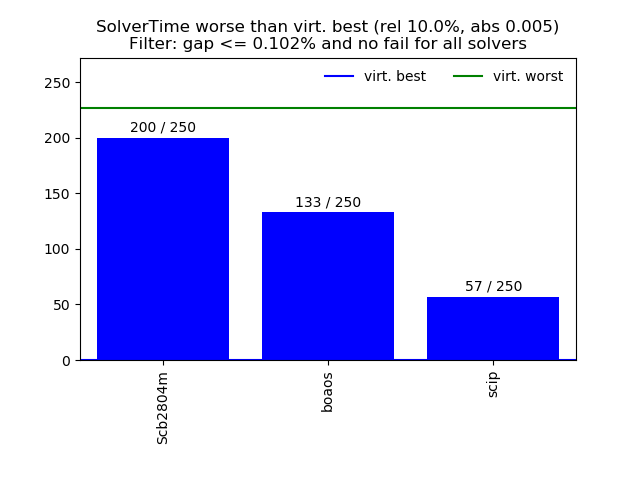
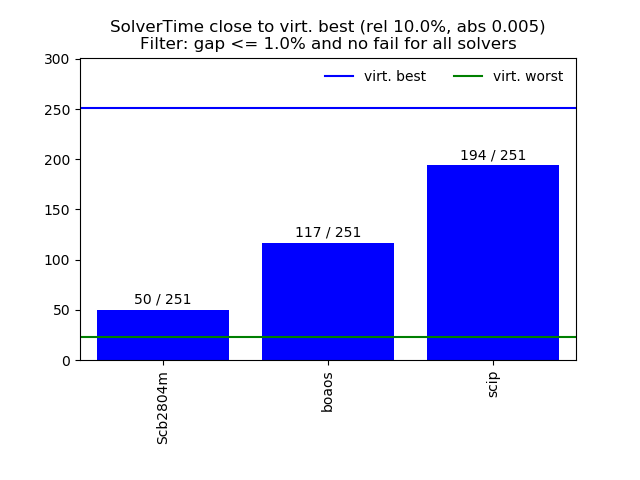
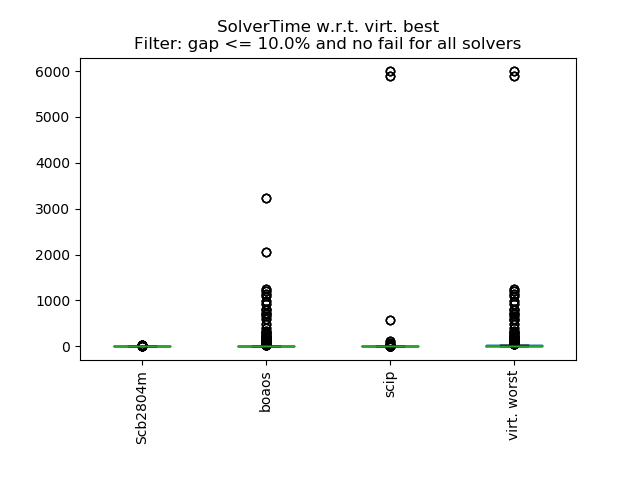
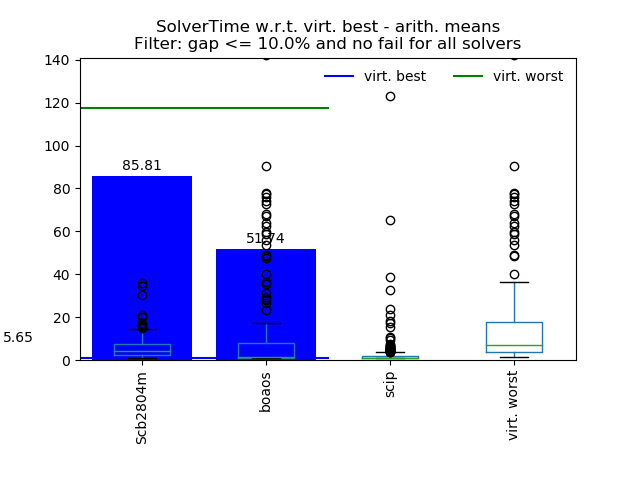
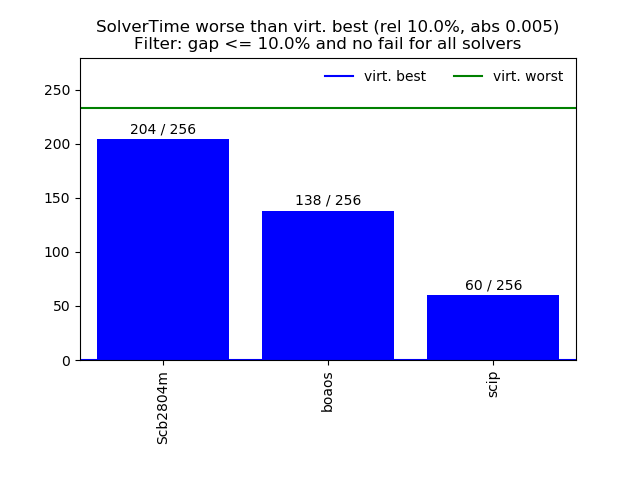
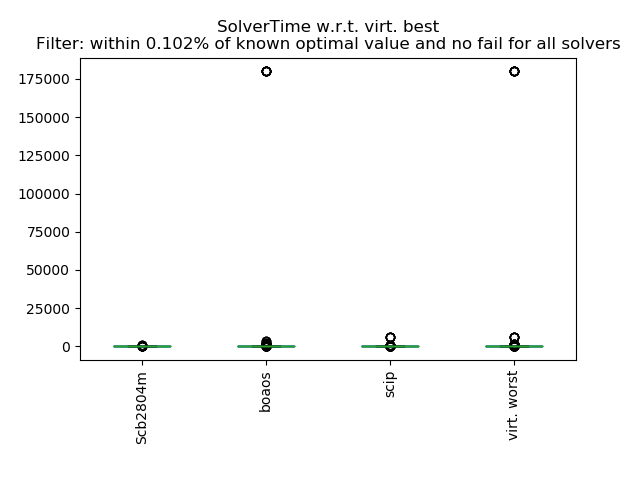
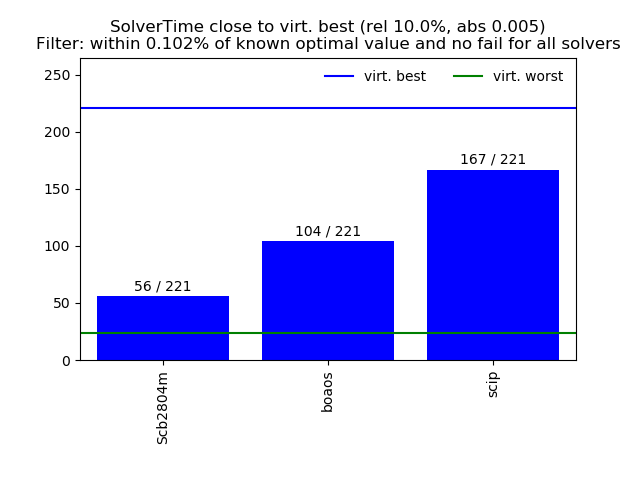
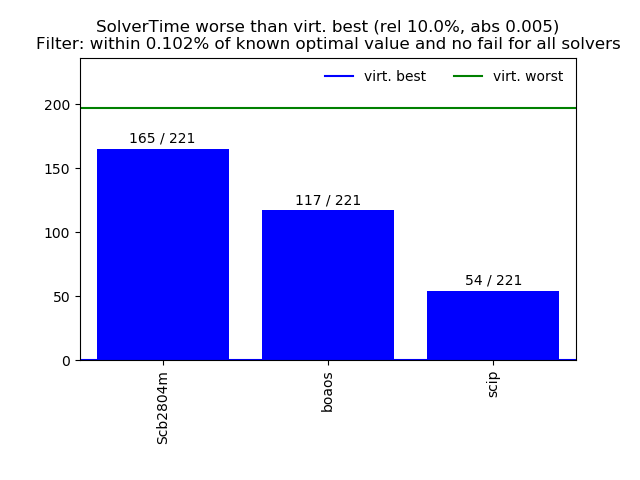
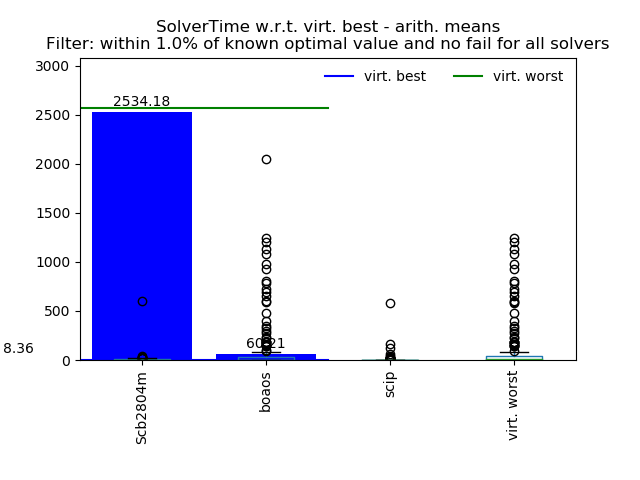
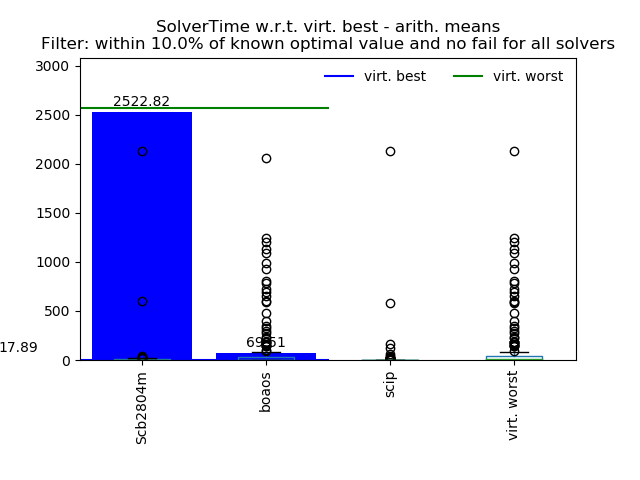
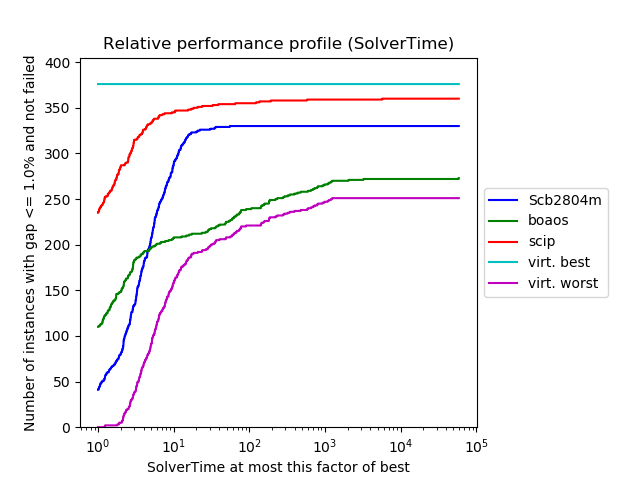
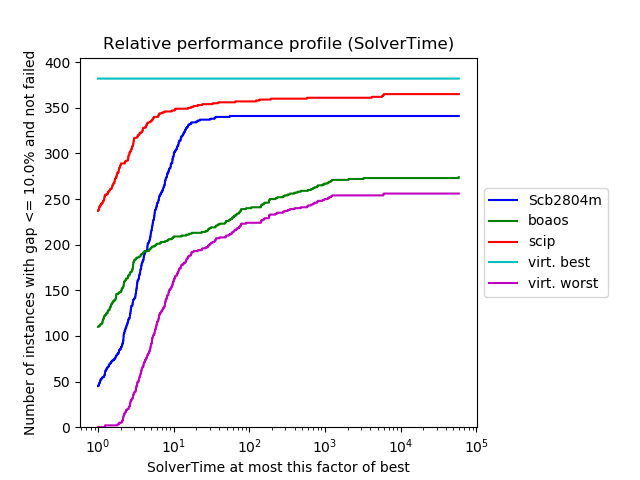
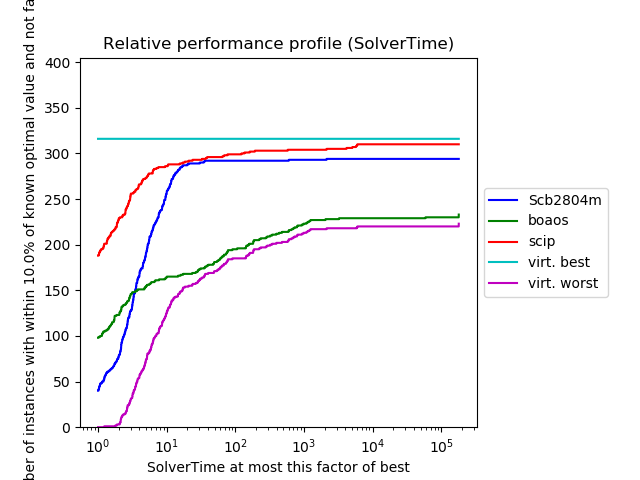
Performance with respect to virt. best:
Tolerance:
relative 0.1
absolute 0.005
| Data | Scb2804m | boaos | scip | virt. worst |
|---|---|---|---|---|
| count | 405.00 | 405.00 | 405.00 | 405.00 |
| arith. mean | 980.99 | 2703.67 | 77.29 | 3085.81 |
| arith. std. | 12787.51 | 20413.88 | 607.07 | 22141.36 |
| min | 1.00 | 1.00 | 1.00 | 1.00 |
| 10.0% | 1.00 | 1.00 | 1.00 | 2.13 |
| 25.0% | 1.40 | 1.00 | 1.00 | 3.70 |
| 50.0% | 3.50 | 2.67 | 1.00 | 8.57 |
| 75.0% | 7.49 | 43.58 | 1.80 | 48.70 |
| 90.0% | 13.79 | 295.41 | 5.25 | 411.42 |
| max | 182000.00 | 182000.00 | 5992.52 | 182000.00 |
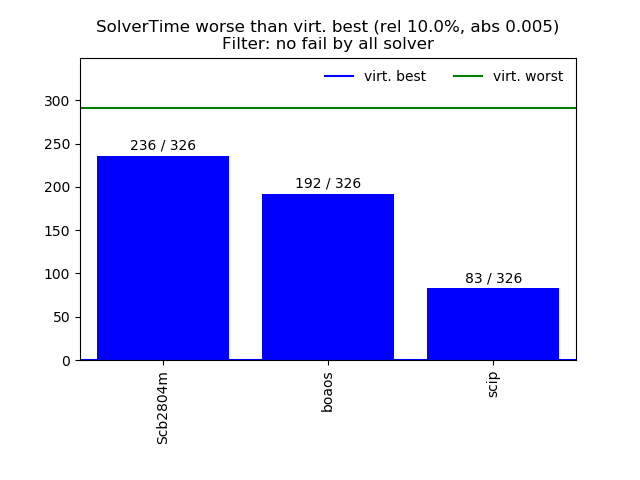
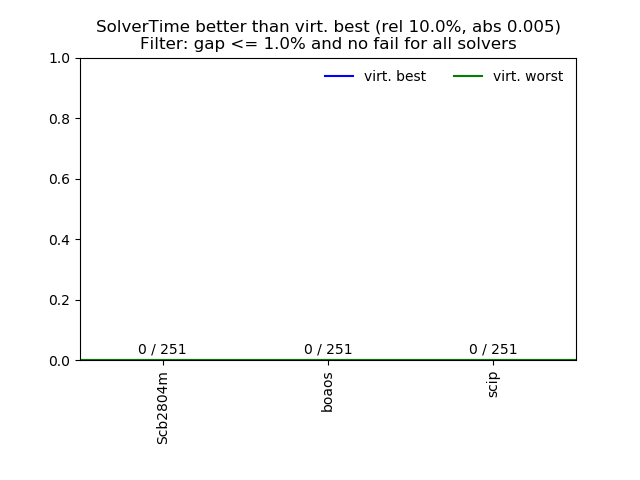
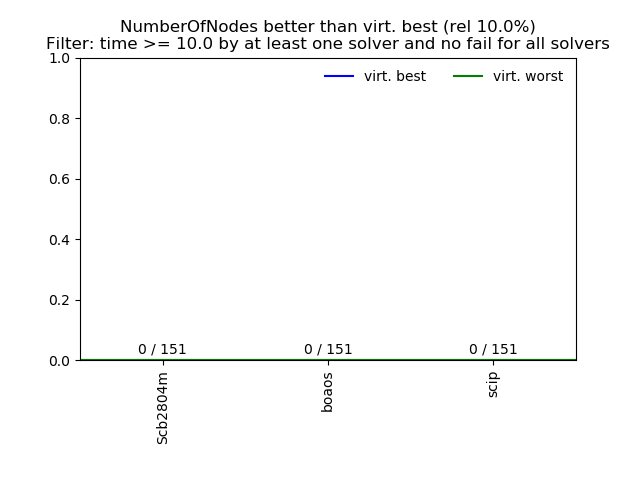
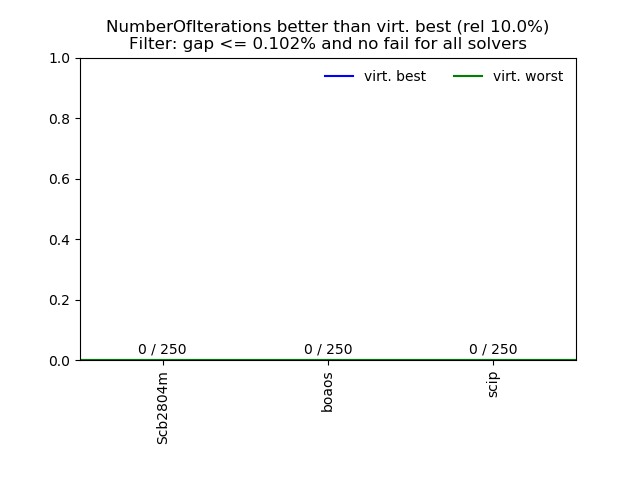
| better | 0.00 | 0.00 | 0.00 | 0.00 |
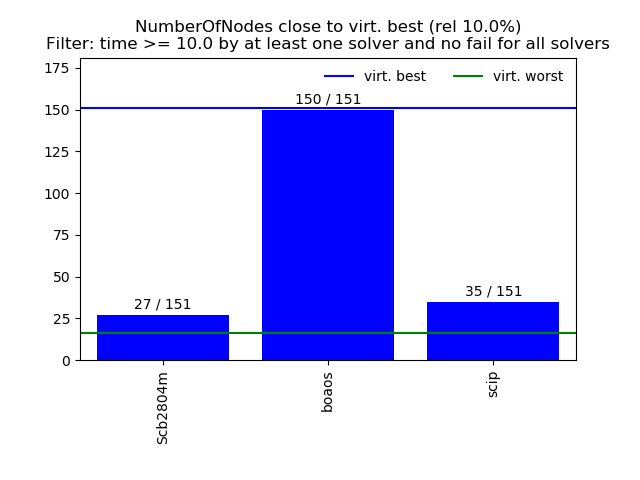
| close | 124.00 | 144.00 | 299.00 | 44.00 |
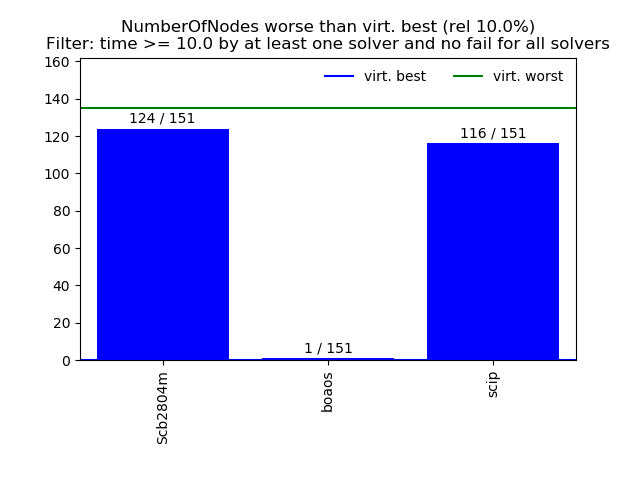
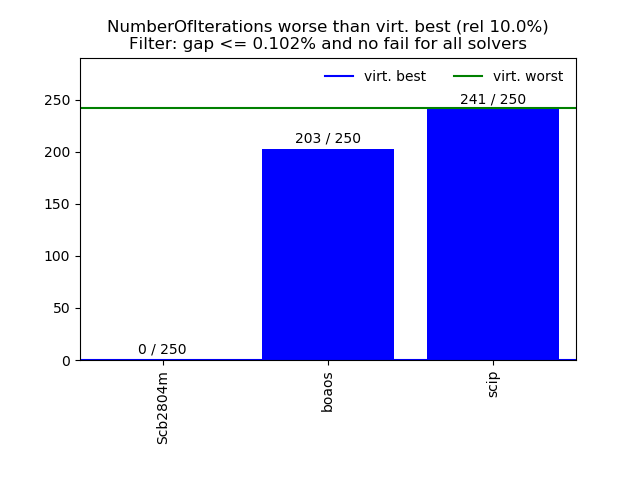
| worse | 281.00 | 261.00 | 106.00 | 361.00 |